Top 3 Price Prediction Bitcoin, Ethereum, Ripple: BTC, ETH and XRP all crash hard
- Bitcoin price closes below its 50-day EMA at $98,611, poised for a further correction.
- Ethereum price fell below $2,500 on Monday, hinting at a downleg ahead.
- Ripple price closes below its ascending trendline, changing the market structure from bullish to bearish.

Bitcoin (BTC), Ethereum (ETH) and Ripple (XRP) closed below their key support level and, at the time of writing on Monday, crashed by 4.3%, 13% and 12.6%, respectively. The technical outlook for all coins shows signs of weakness and suggests a continuation of the downtrend.
Bitcoin bears take the lead
Bitcoin price broke below the $100K support level and closed below its 50-day Exponential Moving Average (EMA) level at $98,611 on Sunday. At the time of writing on Monday, it continues to trade down by 4.3%, around $93,800.
If BTC continues its correction, it could retest its next key support at $90,000. A successful close below this level would extend an additional decline to test its $85,000 level.
The Relative Strength Index (RSI) on the daily chart reads 36, below its neutral level of 50, and points downwards, indicating a strong bearish momentum. Moreover, the Moving Average Convergence Divergence (MACD) also shows a bearish crossover on Friday, hinting at further correction.
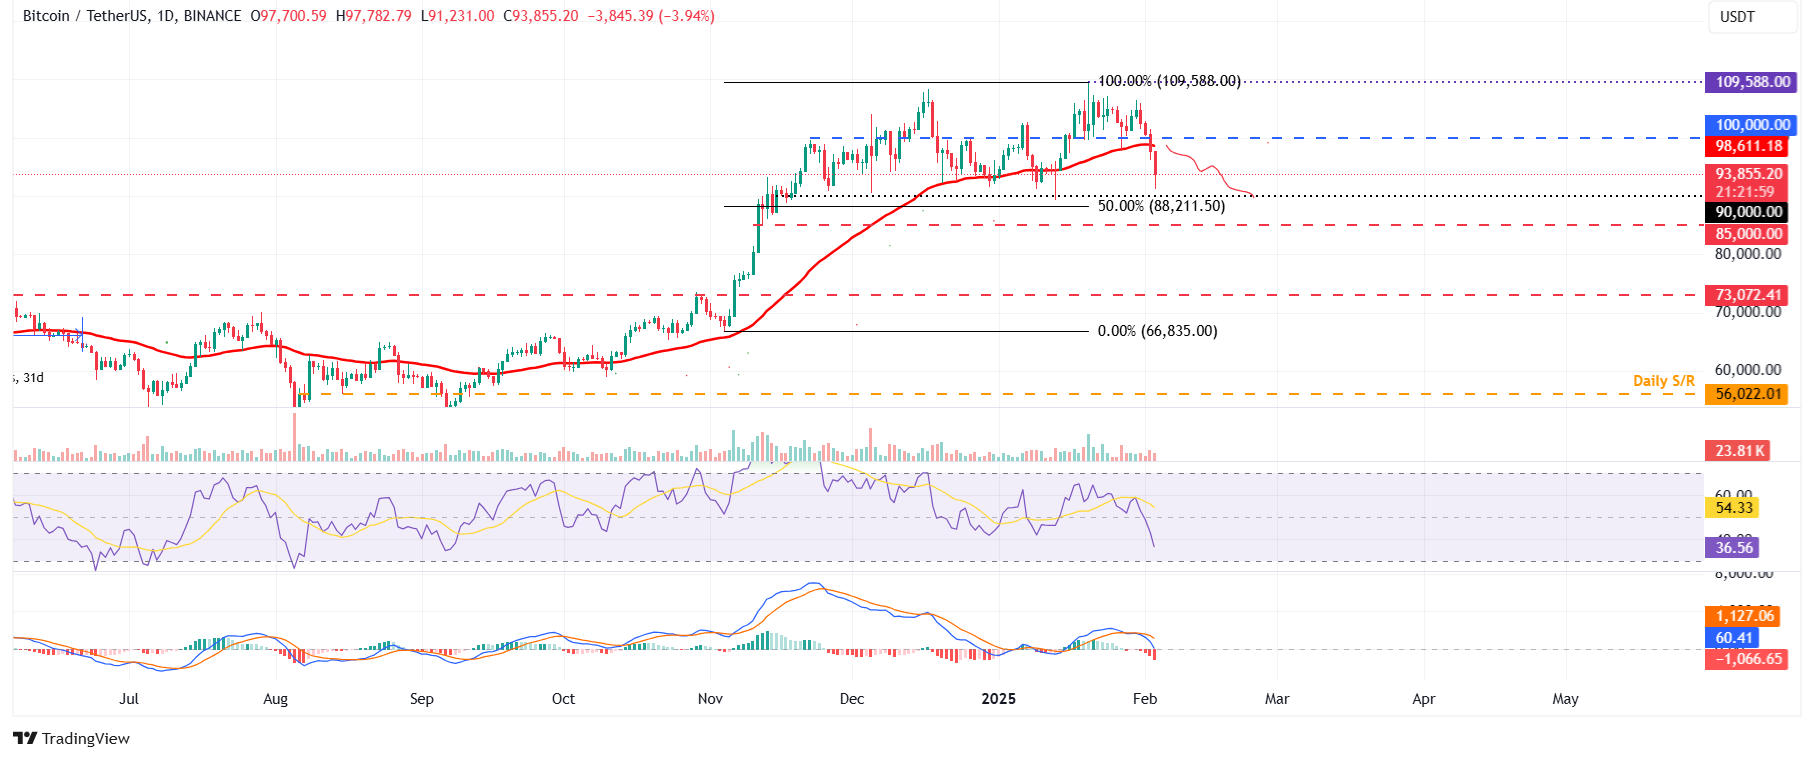
BTC/USDT daily chart
However, if BTC finds support around $90,000 and recovers, it would extend the recovery to retest its 50-day EMA at $98,611.
Ethereum price is poised for a correction as it dips below $2,500
Ethereum price faced a rejection around its descending trendline on Saturday and declined 13.87%, closing below its $3,000 psychologically important level the next day. At the time of writing on Monday, it continues to trade down by 13%, around $2,490.
If ETH continues its decline and closes below $2,359, it will extend the decline to test its next weekly support at $1,905.
The RSI on the daily chart reads 27, below its oversold levels of 30, indicating a strong bearish momentum. The MACD also continues to show a bearish crossover, suggesting the continuation of a bearish trend.
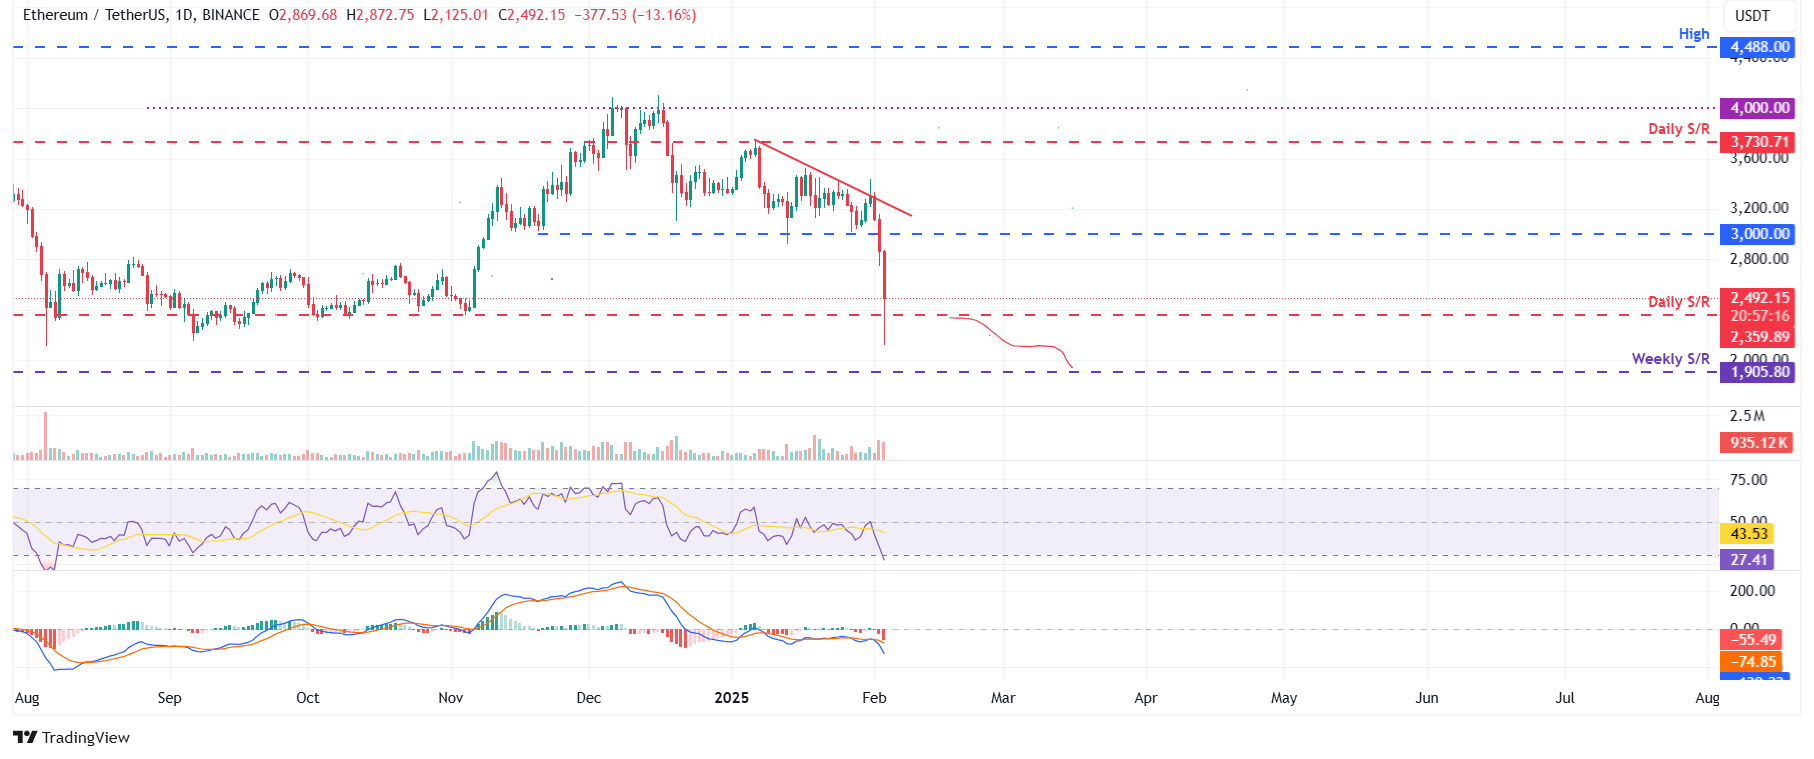
ETH/USDT daily chart
Conversely, if ETH finds support around the daily level of $2,359 and recovers, it could extend the recovery to test its $3,000 level.
Ripple price is set for a downward move as it closes below its ascending trendline
Ripple price breaks below its ascending trendline (drawn by connecting multiple lows since early January) on Sunday and declines by 10.35%, closing below its 50-day EMA at $2.60. At the time of writing on Monday, it continues to trade down by 12.60%, around $2.25.
Suppose XRP continues its pullback and closes below its daily support at $1.96. It could extend the decline to test its weekly support level at $1.40.
The RSI on the daily chart reads 30, around its oversold levels of 30, indicating a strong bearish momentum. The MACD also continues to show a bearish crossover, suggesting the continuation of a bearish trend.
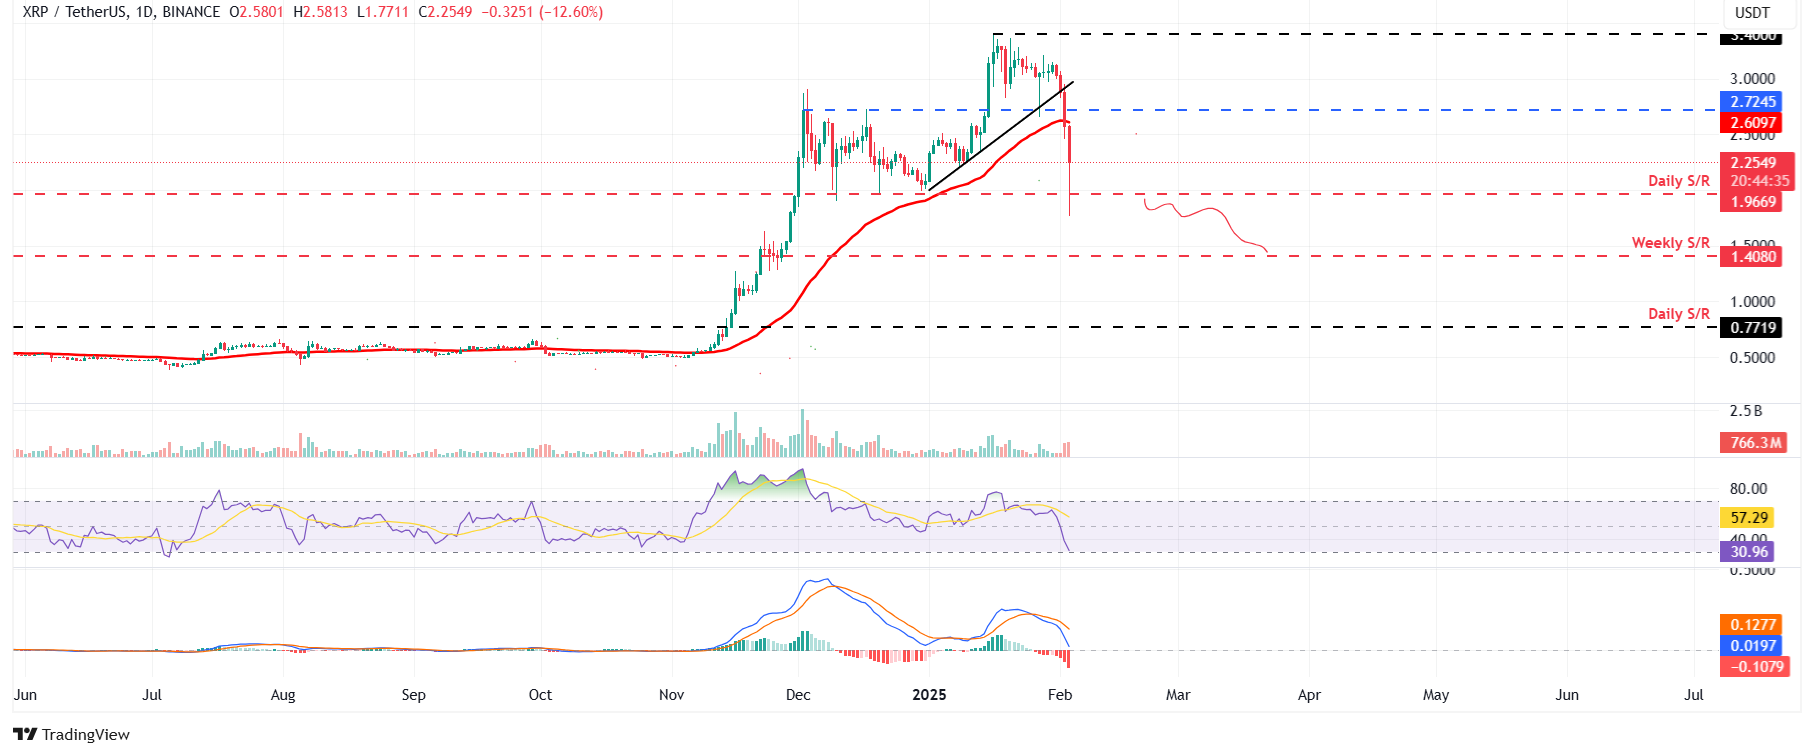
XRP/USDT daily chart
On the other hand, if XRP finds support around the daily level of $2.25 and recovers, it could extend the recovery to test its 50-day EMA at $2.60.
Bitcoin, altcoins, stablecoins FAQs
Bitcoin is the largest cryptocurrency by market capitalization, a virtual currency designed to serve as money. This form of payment cannot be controlled by any one person, group, or entity, which eliminates the need for third-party participation during financial transactions.
Altcoins are any cryptocurrency apart from Bitcoin, but some also regard Ethereum as a non-altcoin because it is from these two cryptocurrencies that forking happens. If this is true, then Litecoin is the first altcoin, forked from the Bitcoin protocol and, therefore, an “improved” version of it.
Stablecoins are cryptocurrencies designed to have a stable price, with their value backed by a reserve of the asset it represents. To achieve this, the value of any one stablecoin is pegged to a commodity or financial instrument, such as the US Dollar (USD), with its supply regulated by an algorithm or demand. The main goal of stablecoins is to provide an on/off-ramp for investors willing to trade and invest in cryptocurrencies. Stablecoins also allow investors to store value since cryptocurrencies, in general, are subject to volatility.
Bitcoin dominance is the ratio of Bitcoin's market capitalization to the total market capitalization of all cryptocurrencies combined. It provides a clear picture of Bitcoin’s interest among investors. A high BTC dominance typically happens before and during a bull run, in which investors resort to investing in relatively stable and high market capitalization cryptocurrency like Bitcoin. A drop in BTC dominance usually means that investors are moving their capital and/or profits to altcoins in a quest for higher returns, which usually triggers an explosion of altcoin rallies.
Author

Manish Chhetri
FXStreet
Manish Chhetri is a crypto specialist with over four years of experience in the cryptocurrency industry.


