SUI expecting the final bullish wave to break above $5
Since our previous Video blog about SUI, the coin rallied more than 900%. Therefore, we’ll be looking at the daily Elliott Wave Structure and explain the current structure within the cycle.
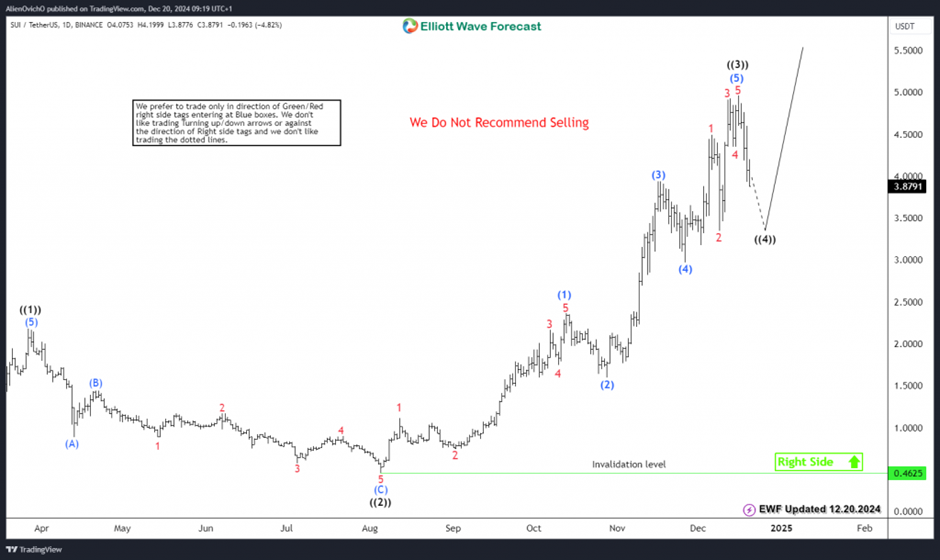
The recent daily rally started in August 2024, SUI established an impulsive 5 waves structure to the upside within wave ((3)). In addition, it reached the 1.618 Fibonacci extension area around $4.7 before ending the cycle. The coin, is currently showing 3 swings from all time lows and consequently it’s expected to finish 4th swing pullback then start another 5th swing to the upside.
The current correction in wave ((4)) is looking for short term extreme equal legs area at $3.7 – $3.1 , moreover, it’s also the 23.6% – 38.2% Fibonacci retracement of the entire rally. Consequently, SUI will find buyers again then turn to the upside within wave ((5)) looking for new all time highs to break above $5.
In conclusion, SUI daily structure remains bullish and the current pullback will find support in 3 , 7 or 11 swings then a final move to the upside will take place before ending the entire 5 waves advance and start a larger 3 waves correction.
SUI daily chart 12.20.2024
Author

Elliott Wave Forecast Team
ElliottWave-Forecast.com


