Stellar Price Forecast: XLM’s Total Value Locked reaches over $62 million
- Stellar price is trading inside a channel; a breakout would indicate bullish momentum.
- DefiLlama data show that XLM’s TVL reached $62 million.
- The technical outlook projects a target of $0.74.

Stellar (XLM) price trades inside a channel pattern; a breakout indicates bullish momentum. Crypto intelligence tracker DefiLlama data shows that XLM’s TVL reaches $62 million while the technical outlook projects a target of $0.74.
Stellar price could move higher on channel breakout
Stellar price trades inside a channel pattern formed by connecting multiple highs and lows with two trendlines from late November. This technical pattern breakout favors the bulls, and the target is generally obtained by measuring the distance between the first daily high and the first daily low to the breakout point. Moreover, XLM’s price has been retested, and support for its 200-day Exponential Moving Average (EMA) has been found at $0.284. At the time of writing on Thursday, it trades at around $0.343.
If XLM breaks decisively and closes above the parallel channel pattern around the $0.416 level, it could rally 77% to test its technical target at $0.740.
The Relative Strength Index (RSI) on the daily chart reads 45, bouncing off its oversold level of 30 last week, indicating mild strength in bullish momentum. For the bullish momentum to be sustained, the RSI must trade above its neutral level of 50 for the rally to continue.
The Moving Average Convergence Divergence (MACD) indicator, which shows a bullish crossover on the daily chart, further supports Stellar’s bullish outlook. The MACD line (blue line) trades above the signal line (yellow line), suggesting the bulls are buying. Additionally, it shows rising green histogram bars above its neutral line zero, indicating bullish momentum.
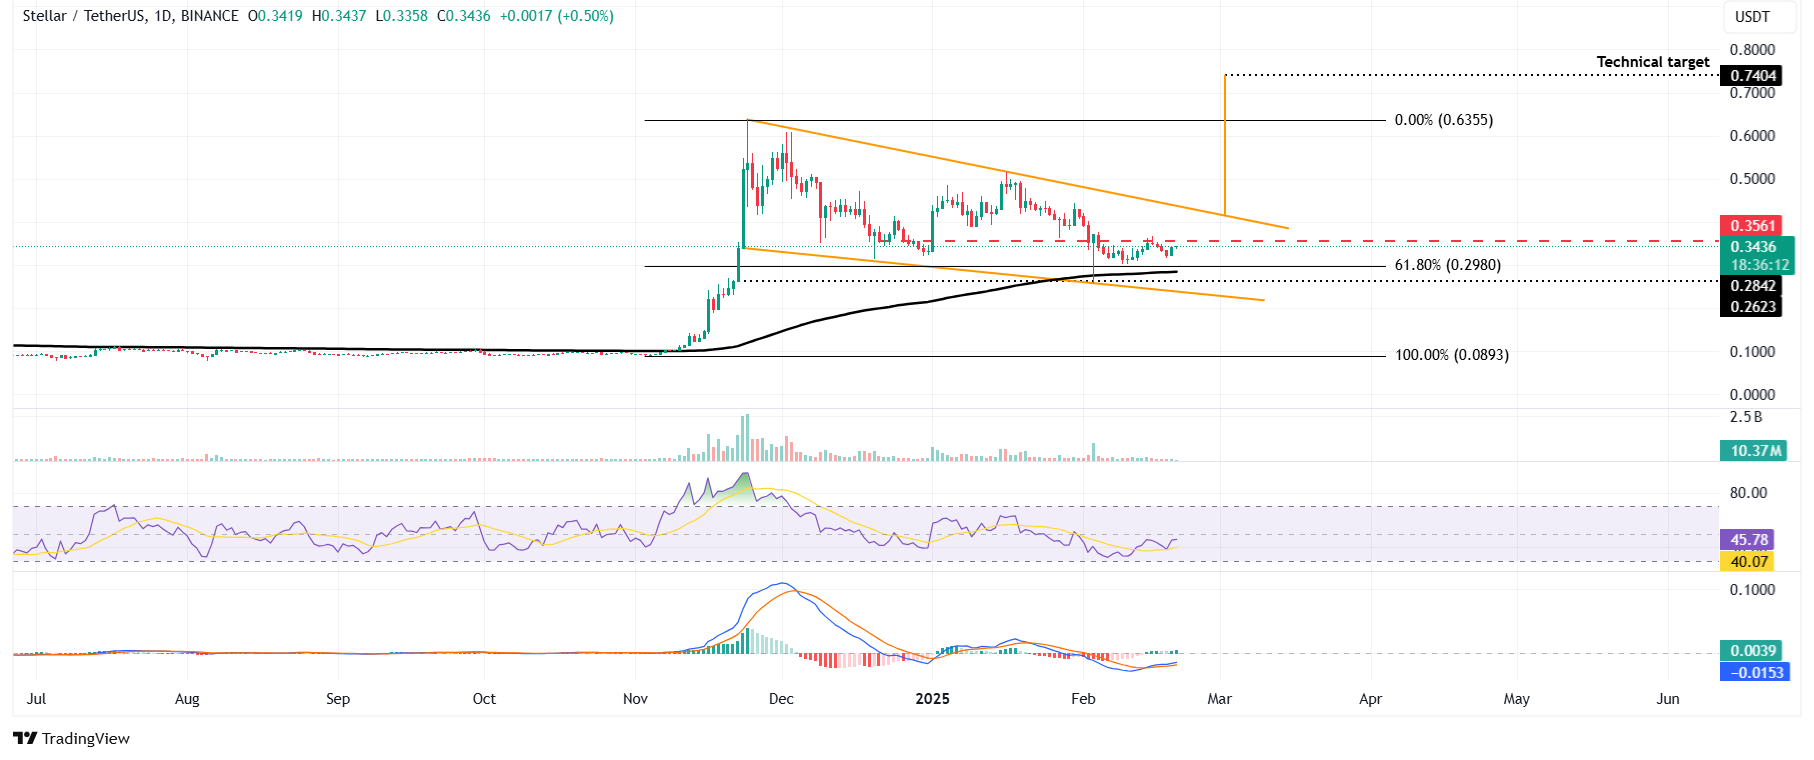
XLM/USDT daily chart
Crypto intelligence tracker DefiLlama data shows that XLM’s TVL increased from $53.57 million on February 9 to $61.84 million on Thursday, constantly rising since February 3.
This increase in TVL indicates growing activity and interest within the Stellar ecosystem. It suggests that more users deposit or utilize assets within XLM-based protocols, adding credence to the bullish outlook.
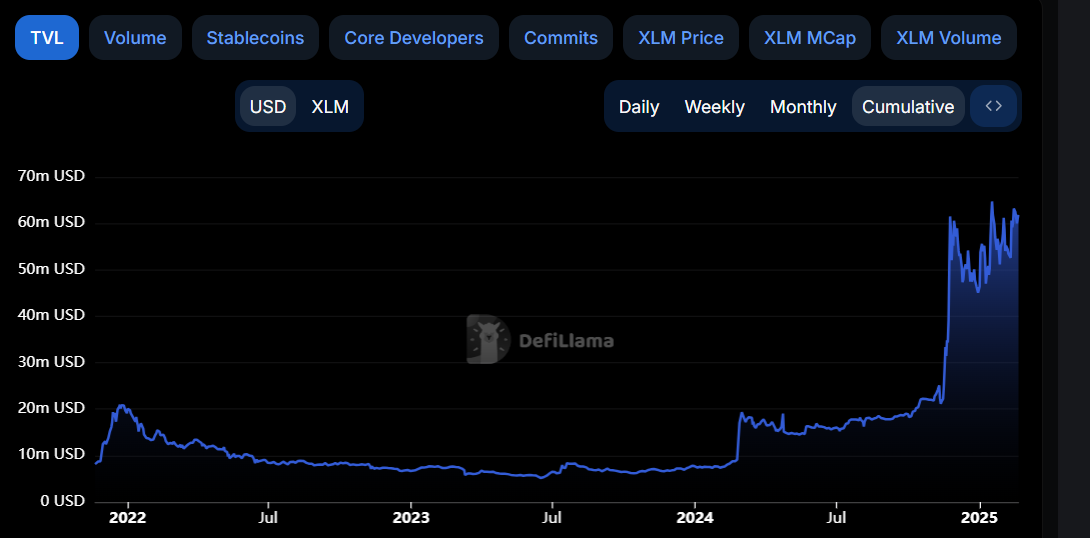
Stellar TVL chart. Source: DefiLlama
Author

Manish Chhetri
FXStreet
Manish Chhetri is a crypto specialist with over four years of experience in the cryptocurrency industry.


