Top 3 Price Prediction Bitcoin, Ethereum, Ripple: BTC, ETH and XRP could decline on FTX repayments pressure
- Bitcoin price has been consolidating between $94,000 and $100,000 for two weeks.
- Ethereum price is trading around $2,390 on Wednesday after a mild fall of 2.63% the previous day.
- XRP is extending its decline on Wednesday after facing resistance around the $2.72 level earlier this week.

Bitcoin (BTC) price has been consolidating between $94,000 and $100,000 for two weeks. Ethereum (ETH) and Ripple (XRP) faced a pullback earlier this week. BTC, ETH and XRP prices could decline further as FTX repayments could raise selling pressure.
According to Arkham data, the bankrupt exchange starts its repayments on Tuesday. Users with FTX claims of under $50,000 have started to receive funds through distribution providers Kraken and Bitgo. This wave of creditors represents approximately $1.2 billion in value.
FTX USERS RECEIVING FUNDS
— Arkham (@arkham) February 18, 2025
Users with FTX claims of under $50,000 have started to receive funds today through distribution providers Kraken and Bitgo.
This wave of creditors represents approximately $1.2B in value. pic.twitter.com/SFGdsNOrBS
Bitcoin stalemate could come to an end soon
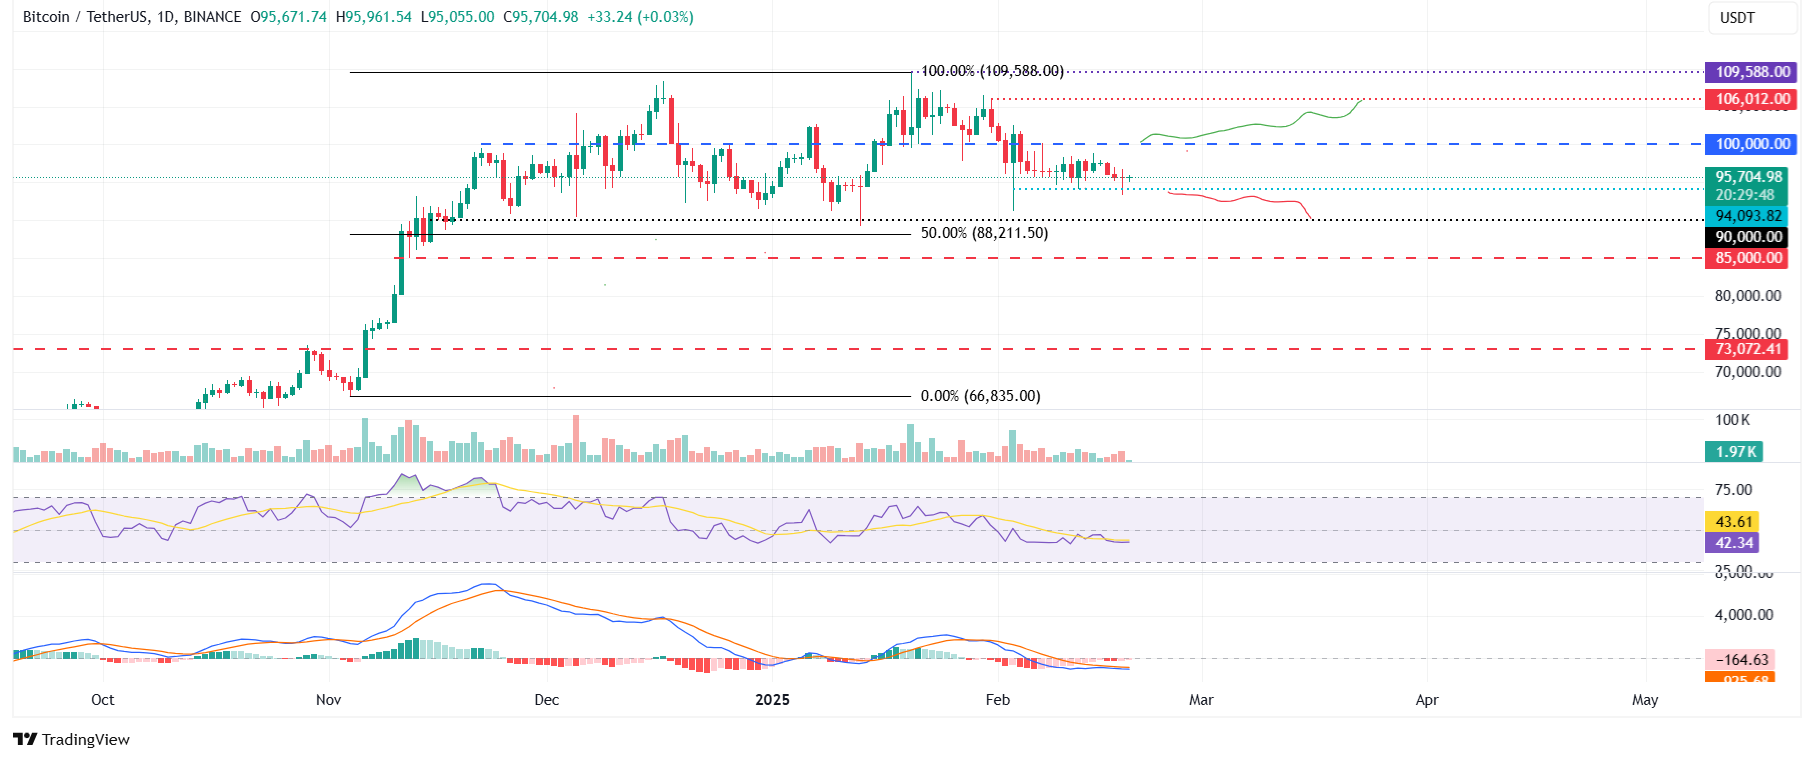
Bitcoin price broke below the $100,000 support level on February 4 and has been consolidating between $94,000 and $100,000 since then. On Tuesday, BTC declined and found support around its lower boundary of the consolidating range. At the time of writing on Wednesday, it hovers around $95,700.
If BTC breaks and closes below the lower boundary of the consolidating range of $94,000, it could extend the decline to test its psychologically important level of $90,000.
The Relative Strength Index (RSI) on the daily chart reads 42, consolidating after being rejected at its neutral level of 50 last week and indicating slightly bearish momentum. Moreover, the Moving Average Convergence Divergence (MACD) showed a bearish crossover and red histogram bars, hinting at further correction.
BTC/USDT daily chart
However, if BTC recovers and breaks above the upper boundary of the consolidating range of $100,000, it would extend the recovery to retest its January 31 high of $106,012.
Ethereum momentum indicators show signs of strength
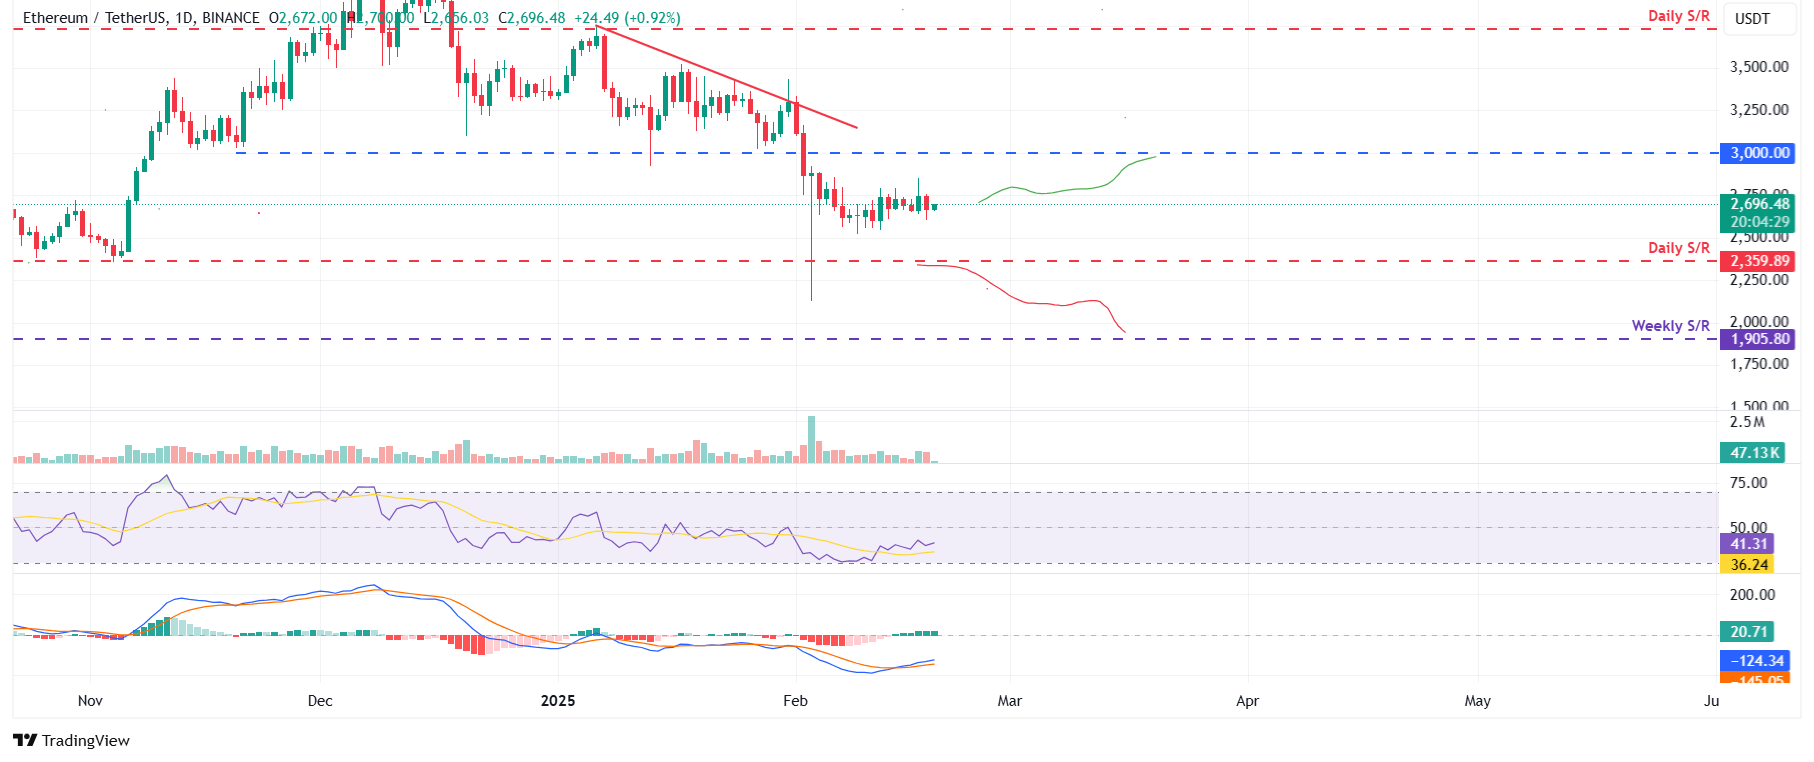
Ethereum price faced a rejection around its descending trendline on February 1 and declined 13.87%, closing below its $3,000 psychologically important level the next day. ETH continued its correction by nearly 9% in the following week. However, ETH prices recovered slightly by 1.3% the previous week. At the time of writing on Wednesday, it hovers around $2,690.
If ETH continues to recover, it could extend the recovery to test the $3,000 level.
The RSI on the daily chart reads 41, bounced off from its oversold level of 30 last week, indicating fewer signs of selling pressure. However, the RSI must trade above its neutral level of 50 to sustain the bullish momentum. Such a development would add a tailwind to the recovery rally. Moreover, the MACD indicator showed a bullish crossover on the daily chart last week, giving buy signals and indicating an upward trend ahead.
ETH/USDT daily chart
However, if ETH continues its decline and closes below $2,359, it will extend the decline to test its next weekly support at $1,905.
Ripple bears aim for $1.96 mark
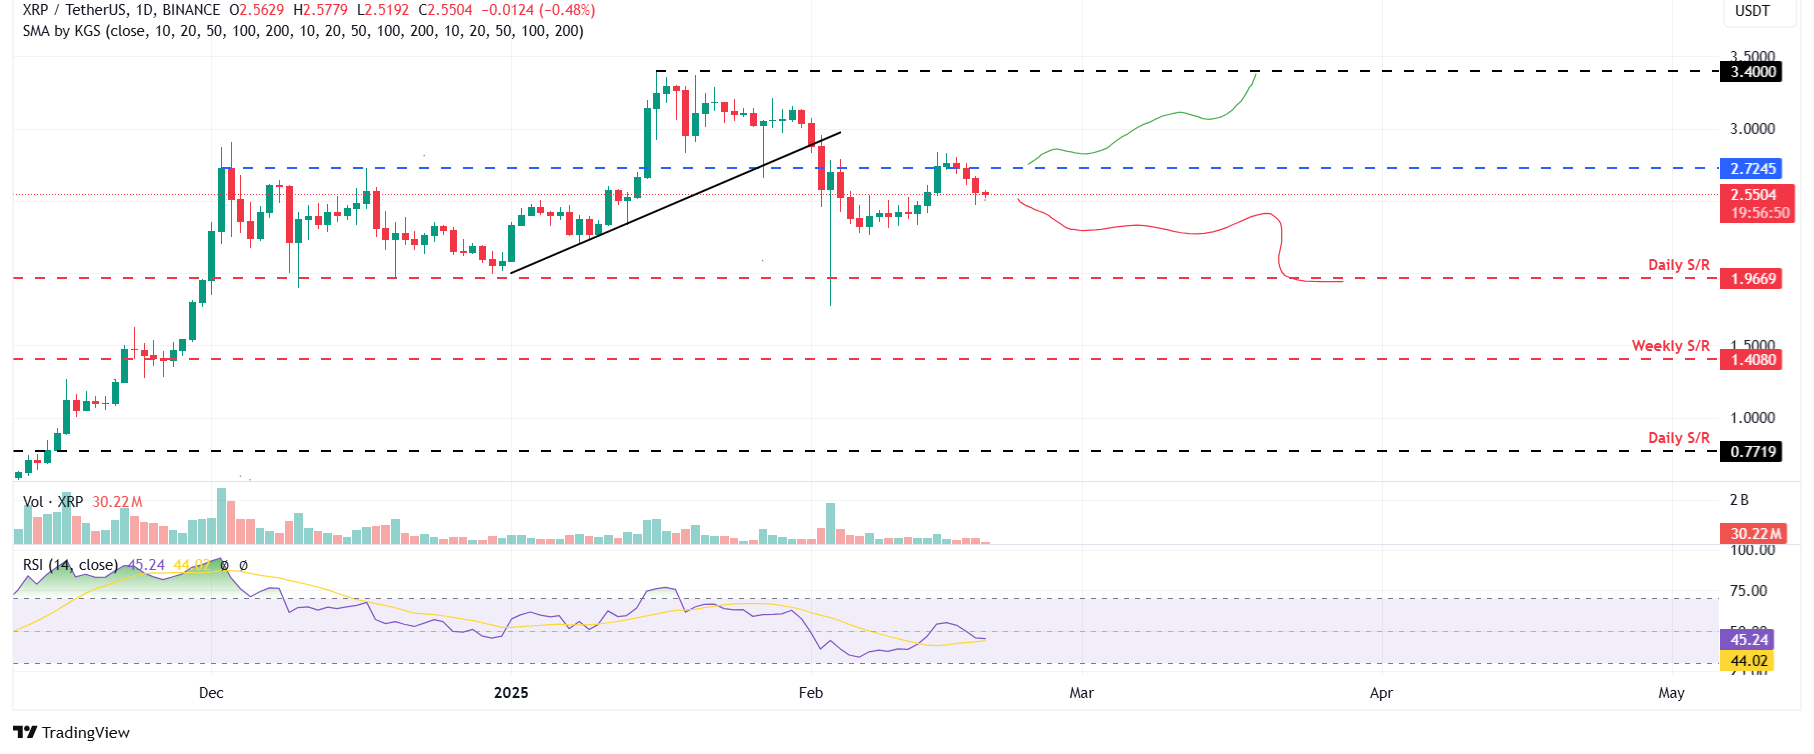
Ripple price rallied 14% last week, breaking above the daily level of $2.72 on Friday and finding support around it on Sunday. However, XRP closed below its $2.72 support level on Monday and declined 6% until Tuesday. At the time of writing on Wednesday, it hovers around $2.55.
If the daily level of $2.72 holds as resistance, it will extend the decline to test its next support level at $1.96.
The RSI on the daily chart reads 45, below its neutral level of 50, indicating bearish momentum.
XRP/USDT daily chart
However, if XRP closes above $2.72 and finds support, it will extend the rally to retest its January 16 high of $3.40.
Bitcoin, altcoins, stablecoins FAQs
Bitcoin is the largest cryptocurrency by market capitalization, a virtual currency designed to serve as money. This form of payment cannot be controlled by any one person, group, or entity, which eliminates the need for third-party participation during financial transactions.
Altcoins are any cryptocurrency apart from Bitcoin, but some also regard Ethereum as a non-altcoin because it is from these two cryptocurrencies that forking happens. If this is true, then Litecoin is the first altcoin, forked from the Bitcoin protocol and, therefore, an “improved” version of it.
Stablecoins are cryptocurrencies designed to have a stable price, with their value backed by a reserve of the asset it represents. To achieve this, the value of any one stablecoin is pegged to a commodity or financial instrument, such as the US Dollar (USD), with its supply regulated by an algorithm or demand. The main goal of stablecoins is to provide an on/off-ramp for investors willing to trade and invest in cryptocurrencies. Stablecoins also allow investors to store value since cryptocurrencies, in general, are subject to volatility.
Bitcoin dominance is the ratio of Bitcoin's market capitalization to the total market capitalization of all cryptocurrencies combined. It provides a clear picture of Bitcoin’s interest among investors. A high BTC dominance typically happens before and during a bull run, in which investors resort to investing in relatively stable and high market capitalization cryptocurrency like Bitcoin. A drop in BTC dominance usually means that investors are moving their capital and/or profits to altcoins in a quest for higher returns, which usually triggers an explosion of altcoin rallies.
Author

Manish Chhetri
FXStreet
Manish Chhetri is a crypto specialist with over four years of experience in the cryptocurrency industry.



