Stellar Price Prediction: XLM is about to take a 35% nosedive after losing critical support
- Stellar price was bounded inside a symmetrical triangle pattern on the 1-hour chart.
- The breakdown below the pattern is a major bearish indicator for XLM.

XLM was in a consolidation period trading sideways awaiting a clear breakout or breakdown from a symmetrical triangle. It seems that bears won and they are targeting $0.121 as the next price point.
Several indicators turn bearish for Stellar price
On the 1-hour chart, XLM established a symmetrical triangle pattern from which has broke down on December 4 after losing the 100-SMA support level and the 50-SMA which are now resistance points.
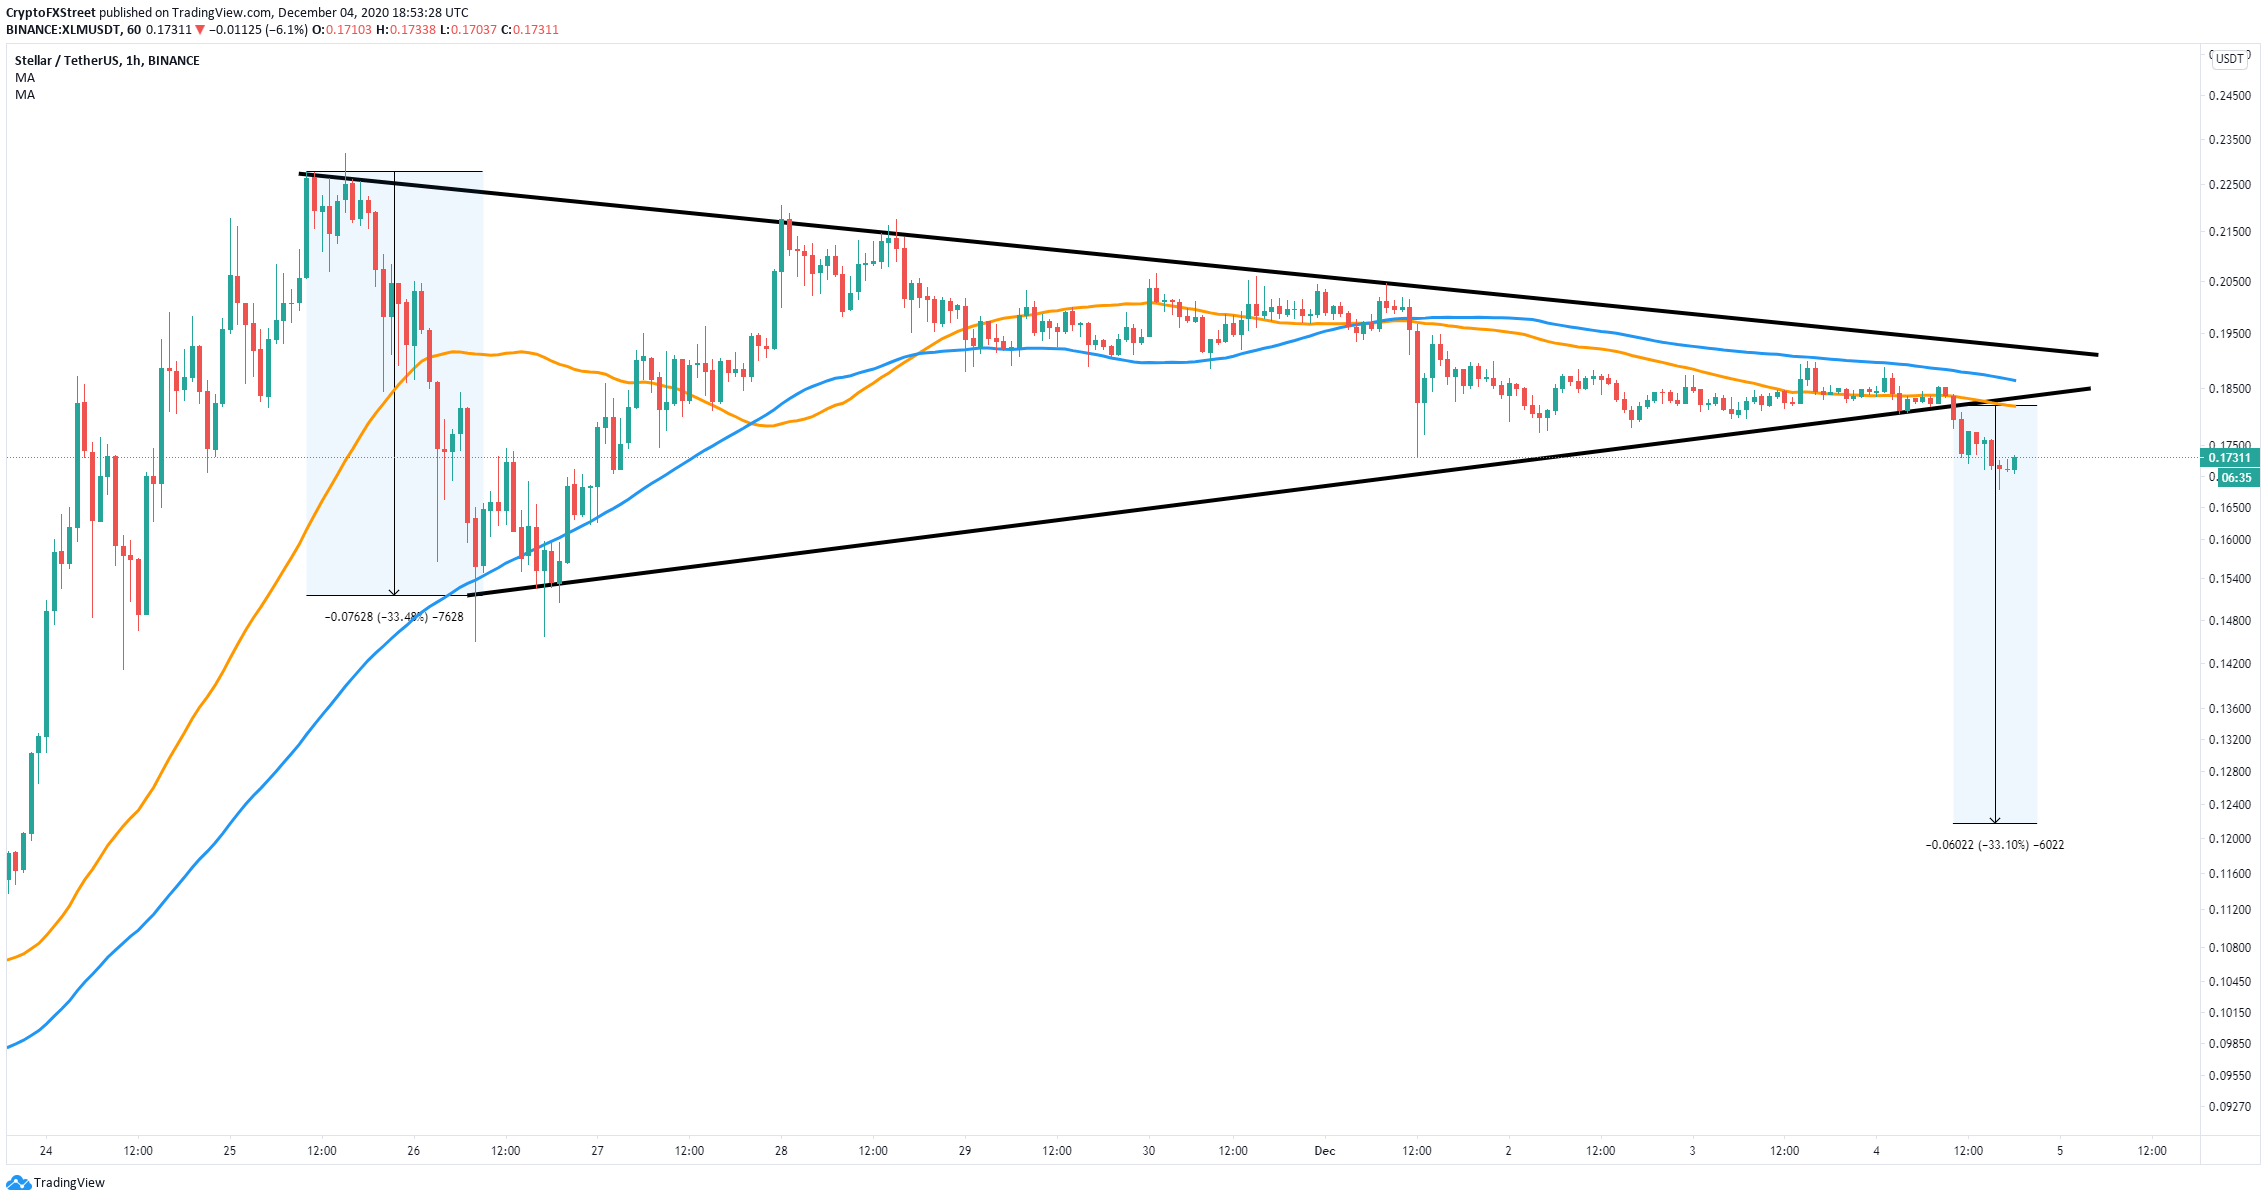
XLM/USD 1-hour chart
Using the height of the pattern as a reference it seems that the long-term price target for the bears will be around $0.121, a 33% nosedive. However, not every indicator is bearish.
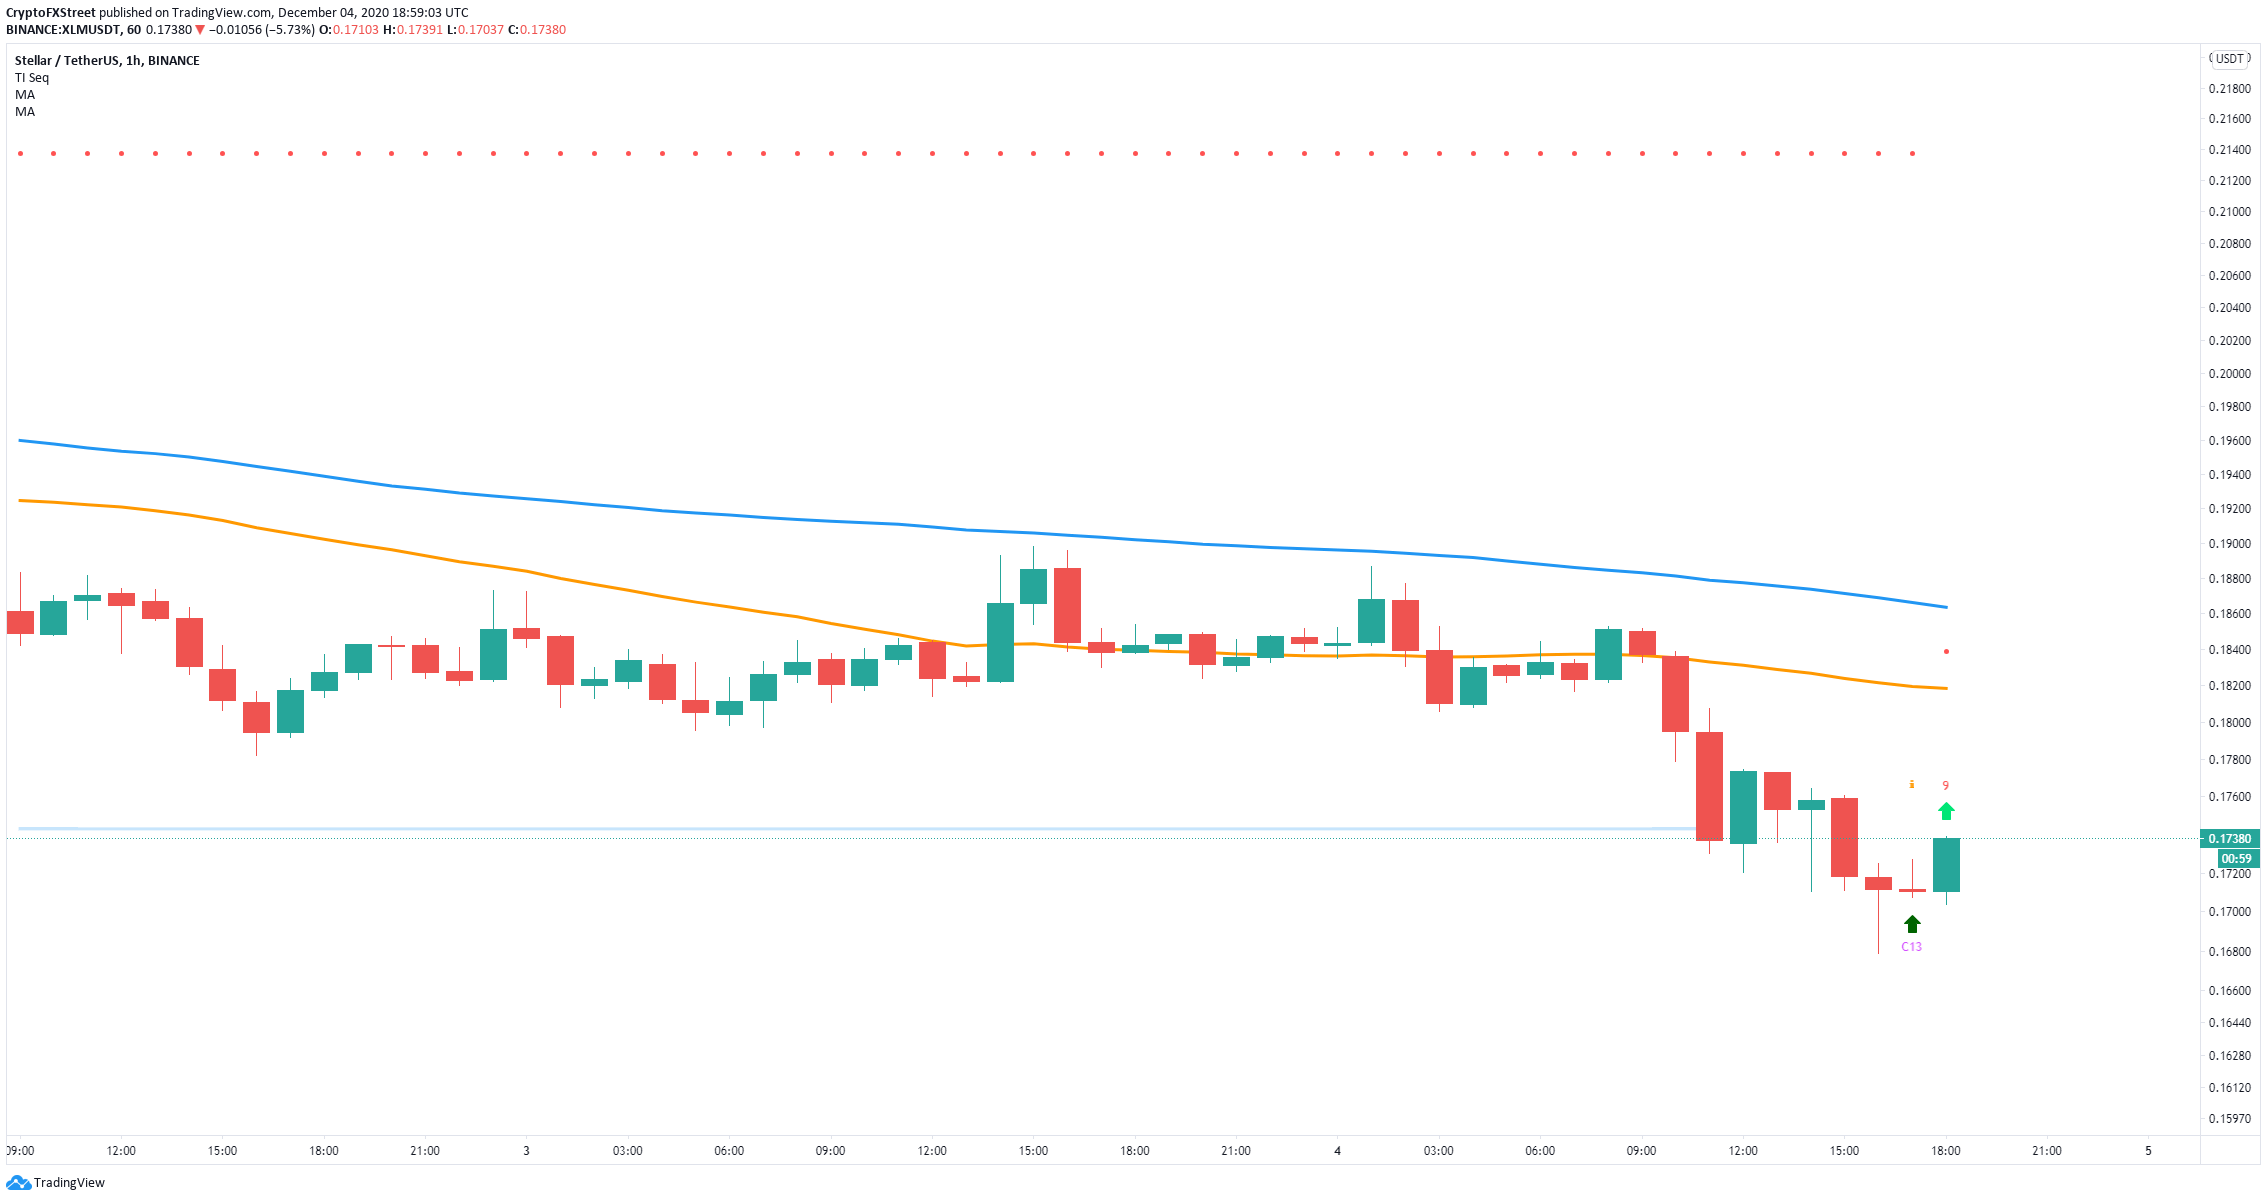
XLM/USD 1-hour chart
For instance, on the same time frame, the TD Sequential indicator has just presented a buy signal. Bulls are targeting the 50-SMA at $0.182 which coincides with the lower trendline of the pattern. After a breakdown, assets tend to re-test the boundary broken.
Author

Lorenzo Stroe
Independent Analyst
Lorenzo is an experienced Technical Analyst and Content Writer who has been working in the cryptocurrency industry since 2012. He also has a passion for trading.


