|

Stellar Price Forecast: XLM to regain lost ground, technicals show 7% move in sight

  • Stellar is moving towards an imminent breakthrough from a triangle formation.
  • XLM price may move by 7% in either direction.

Stellar (XLM) hit the all-time high at $0.2337 on November 25 amid a significant bullish trend on the cryptocurrency markets and has been drifting down ever since. At the time of writing, XLM/USD is changing hands at $0.184, having lost over 2% in the past 24 hours. Despite the retreat, it is still 15% higher on a week-to-week basis.

Stellar is the 11th largest digital asset with a current market capitalization of $3.9 billion and an average daily trading volume of $504 million. Stellar's trading volumes peaked at $3.7 at the end of November amid a substantial price increase.

Stellar is at a crossroads

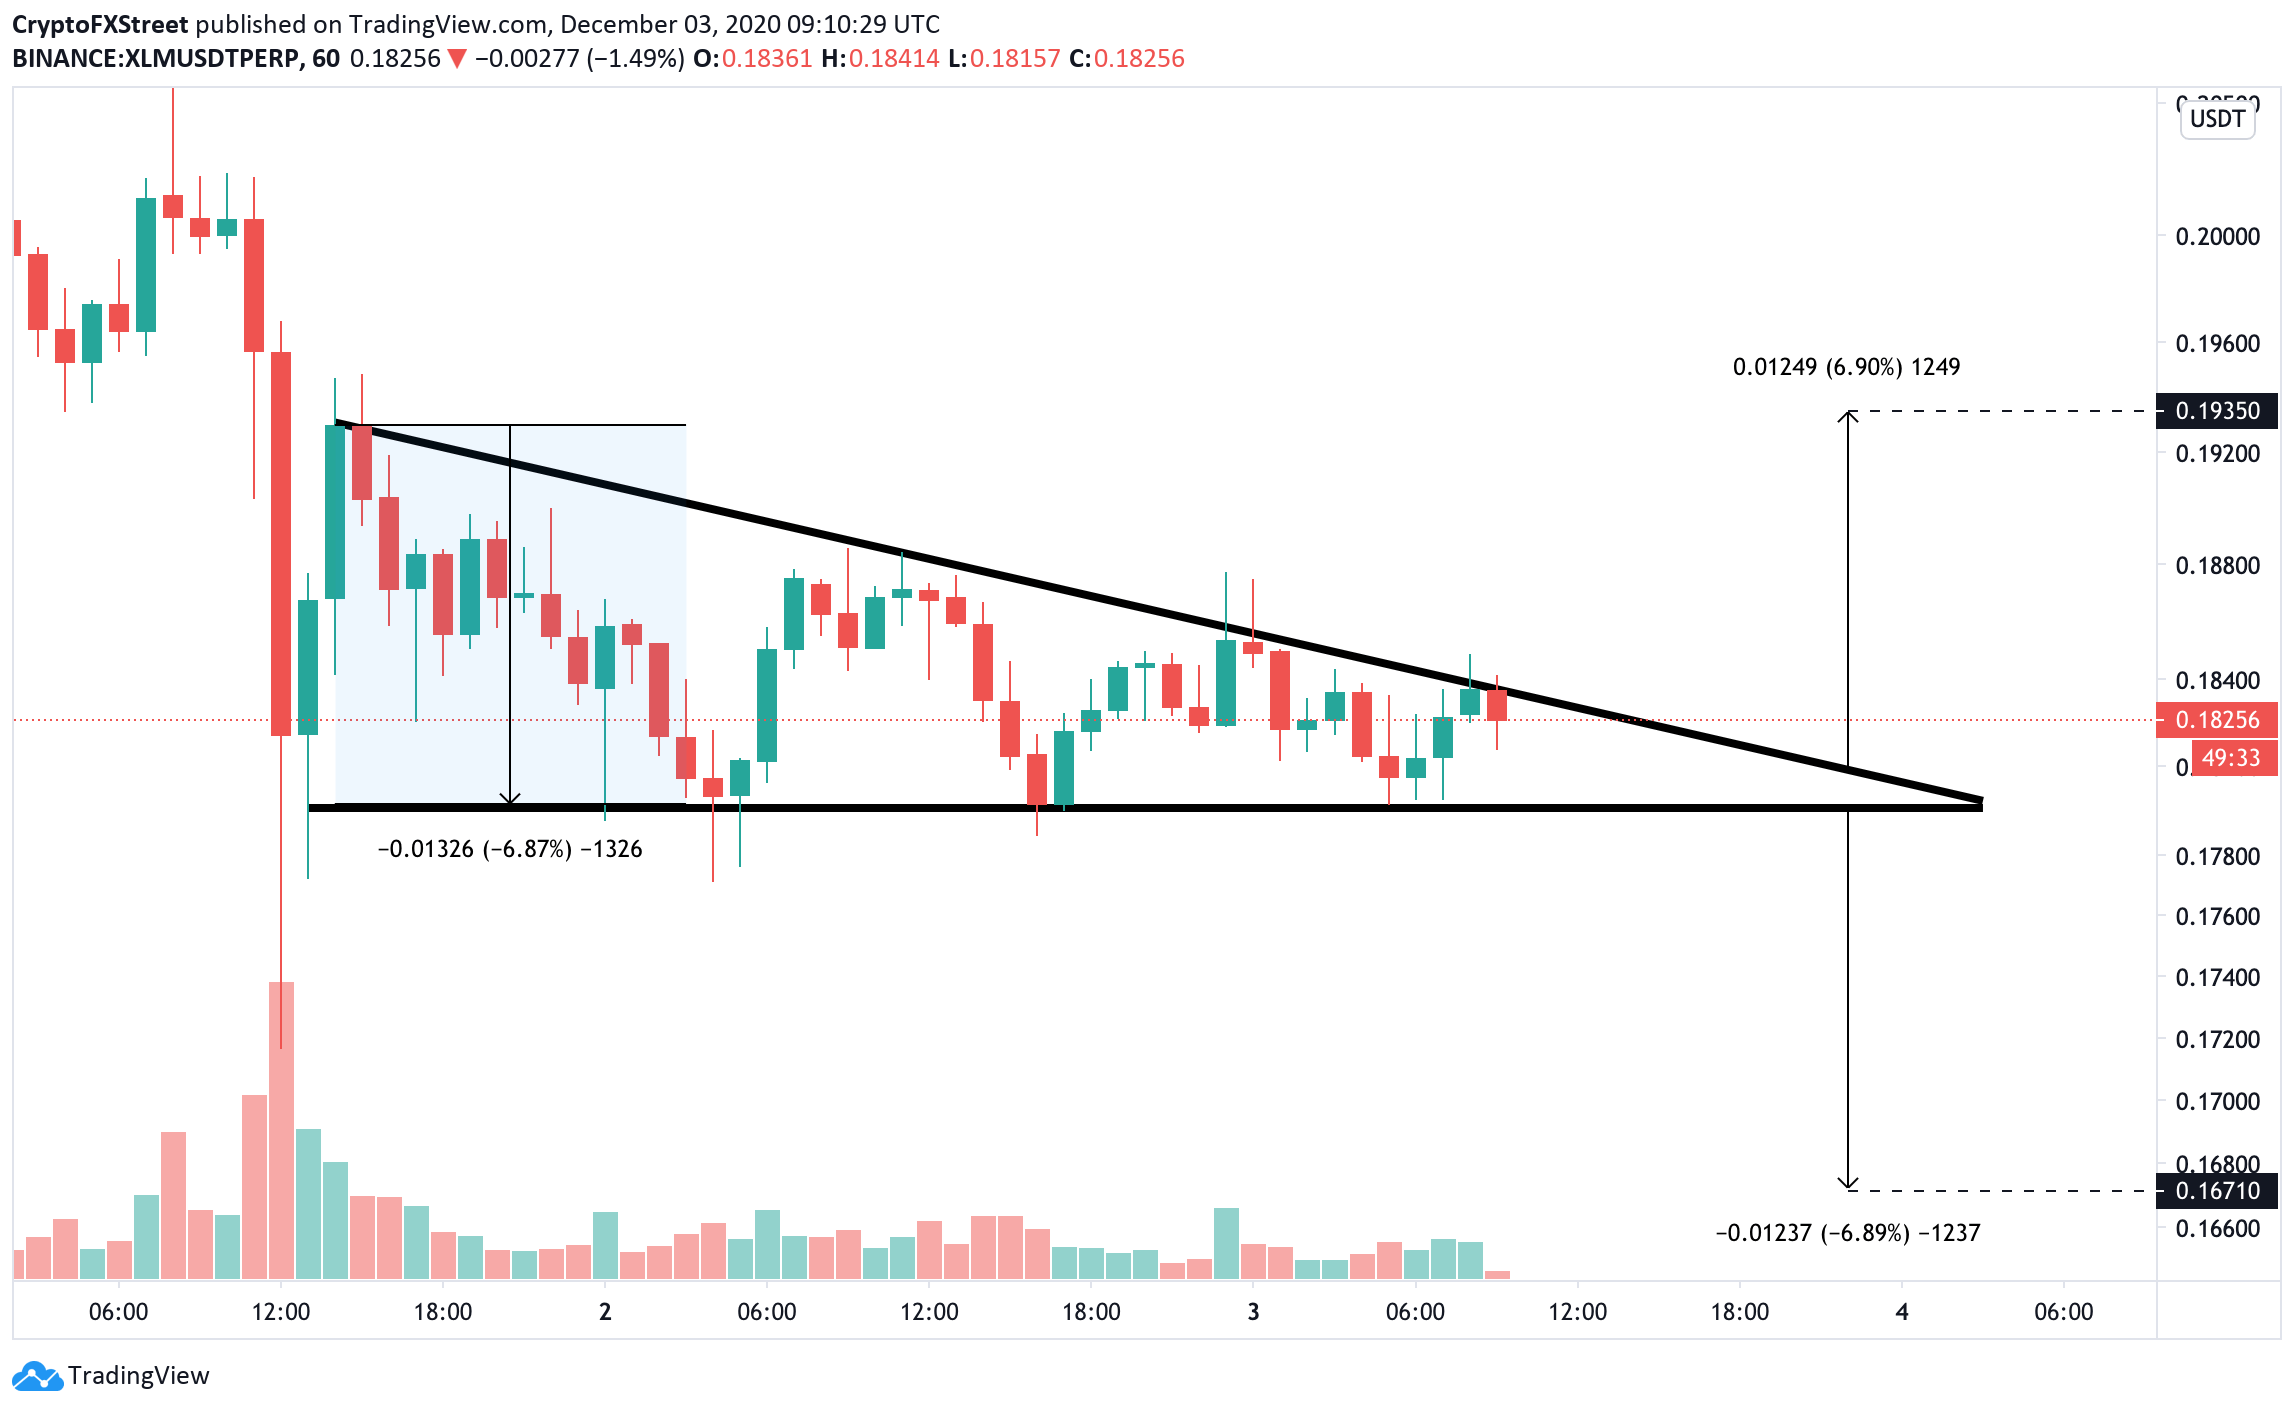
From a short-term perspective, Stellar price is moving within a descending triangle pattern on the 1-hour chart. Since this formation is considered to be a bearish signal, XLM may be vulnerable to further losses if the local support created by the lower boundary of the triangle at $0.18 gives way. 

A sustainable move below this area will open up to the estimated bearish target of $0.167. This target represents a nearly 7% decline. It is calculated by measuring the distance between the widest point of the triangle and adding it to the breakout point.
XLM/USD 1-hour chart

XLM/USD 1-hour chart

Meanwhile, a breakthrough above the resistance line created by the upper boundary of the descending triangle formation will negate the immediate bearish scenario and push the price towards $0.193, which is also a 7% move from a breakout point. Once this barrier is out of the way, the psychological $0.2 will come into focus, followed by the all-time high of $0.2337. 

Author

Tanya Abrosimova

Tanya Abrosimova

Independent Analyst

 

More from Tanya Abrosimova
Share:

Editor's Picks

Zcash Price Forecast: ZEC tests $500 threshold amid risks of a deeper correction

Zcash price hovers around $500 on Friday after five consecutive days of losses, testing a crucial support cluster. The privacy coin holds retail strength, with a positive funding rate despite over $2 million in liquidations over the last 24 hours, suggesting bullish bias persists.

Dogecoin Price Forecast: DOGE eyes $0.065 after breaking key support level

Dogecoin price trades in the red below $0.0700 on Friday, following a 5% drop the previous day. DOGE loses retail strength as broader market speculative demand eases with elevated tensions between the US and Iran. The technical outlook for DOGE points to deeper losses below $0.065.

Cardano Price Forecast: Mixed signals cap ADA recovery

Cardano extends its decline, trading below $0.168 on Friday after facing rejection at the 50-day EMA earlier this week. Mixed derivatives metrics indicate traders' indecision, while neutral momentum indicators suggest ADA lacks a catalyst for a sustained move in either direction. Derivatives data for Cardano show mixed sentiments among traders.

Crypto Market Overview: Bitcoin tests 50-day EMA support – Pi Network and Sky lead losses
The broader cryptocurrency market faces headwinds with rising tensions between the US and Iran, pushing Bitcoin (BTC) down to its 50-day Exponential Moving Average (EMA) support around $65,135 on Friday. Under pressure, Pi Network (PI) and Sky (SKY) emerge as the worst-performing crypto assets over the last 24 hours.
Bitcoin’s potential recovery in the second half hinges on these 4 catalysts
Bitcoin (BTC) has fallen over 34% in the first half of this year as the King Crypto failed to capitalize on a good semester for risk assets despite the woes from the Iran war.