Solana Elliott Wave technical analysis [Video]
![Solana Elliott Wave technical analysis [Video]](https://editorial.fxsstatic.com/images/i/SOL-bullish-animal.png)
Elliott Wave Analysis – TradingLounge Daily Chart.
Solana/US Dollar (SOLUSD).
SOLUSD Elliott Wave technical analysis
-
Function: Counter Trend.
-
Mode: Corrective.
-
Structure: Zigzag.
-
Position: Wave A.
-
Direction next higher degrees: Wave B or 2.
-
Wave cancel invalid level: –
-
Details: SOL/USD has pulled back from its peak of $295.31 and is currently moving towards the major support zone at $125.97.
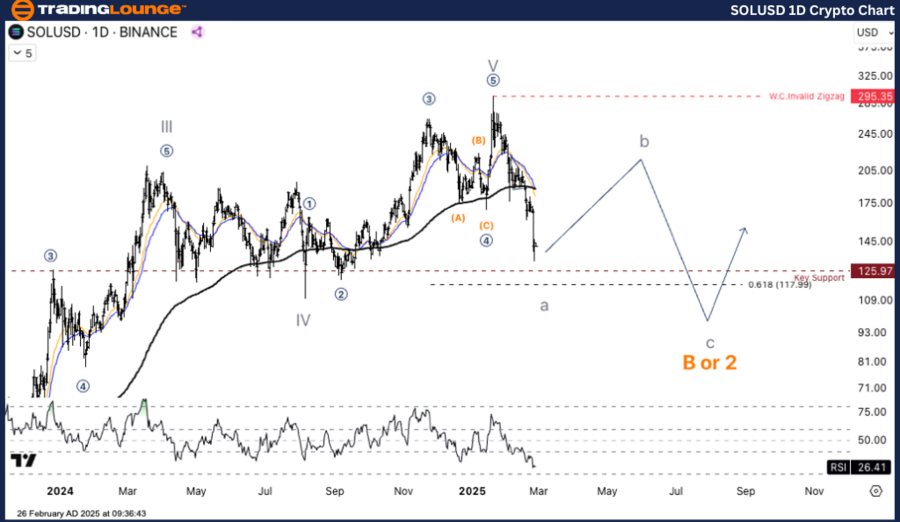
Solana/US Dollar (SOLUSD) trading strategy.
Solana (SOL/USD) was one of the top-performing digital assets, reaching a high of $295.31. However, the price has undergone a significant correction, leading Elliott Wave traders to assess whether this is a temporary consolidation or the start of a long-term downtrend.
Currently, SOL/USD is approaching the critical support level at $125.97. The price may continue declining towards the next major support at $117.99 (Fibonacci 61.8%). If SOL/USD fails to sustain above this level, it could move further downward within Wave B or 2.
Trading Strategies.
Strategy.
Long Strategy.
Buy on pullback to key support levels.
-
If SOL/USD enters the $125 – $117 range and buying pressure emerges, this could be a potential buying opportunity for a short-term trade.
-
Profit target: $160 – $180 (Wave B).
Risk Management.
-
If SOL/USD breaks below $117, the downtrend may strengthen, requiring traders to look for deeper support between $80 – $90.
Elliott Wave Analysis – TradingLounge H4 Chart.
Solana/US Dollar (SOLUSD).
SOLUSD Elliott Wave technical analysis
-
Function: Counter Trend.
-
Mode: Corrective.
-
Structure: Zigzag.
-
Position: Wave A.
-
Direction next higher degrees: Wave B or 2.
-
Wave cancel invalid level: –
-
Details: SOL/USD has pulled back from its peak of $295.31 and is currently moving towards the major support zone at $125.97.
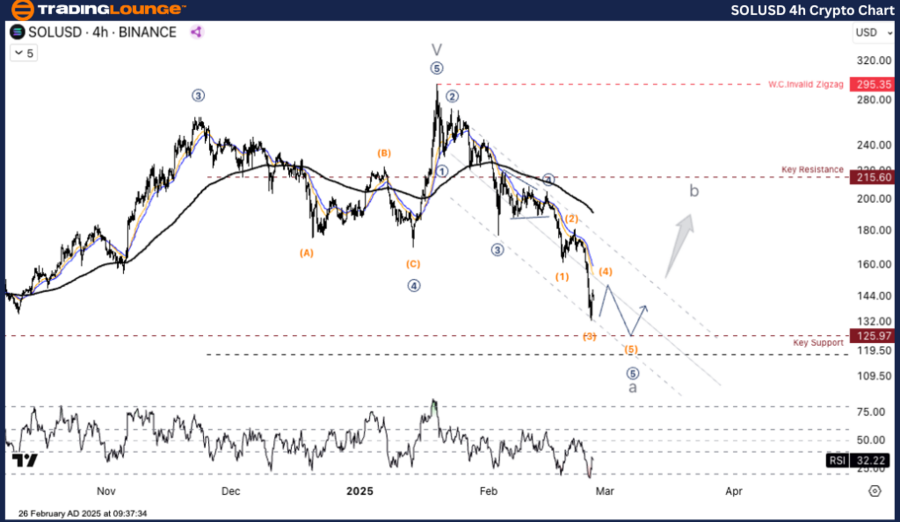
Solana/US Dollar (SOLUSD) trading strategy.
Solana (SOL/USD) was among the most sought-after digital assets, reaching a high of $295.31. However, following the recent correction, traders are questioning whether this is temporary consolidation or a longer-term decline.
Currently, SOL/USD is testing the $125.97 major support level. The price may continue to drop towards $117.99 (Fibonacci 61.8%). If the price fails to hold above this level, Wave B or 2 could push it further down.
Trading Strategies.
Strategy.
Long Strategy.
Buy on pullback to key support levels.
-
If SOL/USD enters the $125 – $117 range and shows signs of buying strength, it could be a short-term buying opportunity.
-
Profit target: $160 – $180 (Wave B).
Risk Management.
-
If SOL/USD breaks below $117, the downtrend may extend, requiring traders to watch for support between $80 – $90.
TradingLounge Analyst: Kittiampon Somboonsod, CEWA
SOLUSD Elliott Wave technical analysis [Video]
Author

Peter Mathers
TradingLounge
Peter Mathers started actively trading in 1982. He began his career at Hoei and Shoin, a Japanese futures trading company.


