Solana price ticks up on steady institutional interest as SOL staking ETF inflow hits $40 million
- Solana rebounds toward $155 with the 50-day EMA and the 100-day EMA offering support.
- Solana staking ETF sees inflow volume exceed $40 million on its second day of trading.
- SSK is the first regulated Solana ETF in the US, combining access to Solana and staking rewards.

Solana’s (SOL) price showcases bullish potential, rising over 2% to trade at around $154 on Wednesday. The smart contract token's recovery follows a strong downtrend from highs of $187 in May to the support tested at $125 on June 22.
The 22% price increase off the range low can be attributed to growing institutional interest, characterised by the adoption of tokenized real-world assets (RWAs) and exchange-traded funds (ETFs).
Solana staking ETF sees $40 million inflow
The Solana staking ETF, which provides both institutional and retail investors access to assets locked in smart contracts, launched on Tuesday under the ticker SSK. This product combines exposure to SOL as a spot asset and staking rewards, all within the traditional financial market.
SSK was designed by REX Shares and Osprey Funds to merge on-chain staking rewards with the simple and secure off-chain ETF trading accessed via traditional stock exchanges.
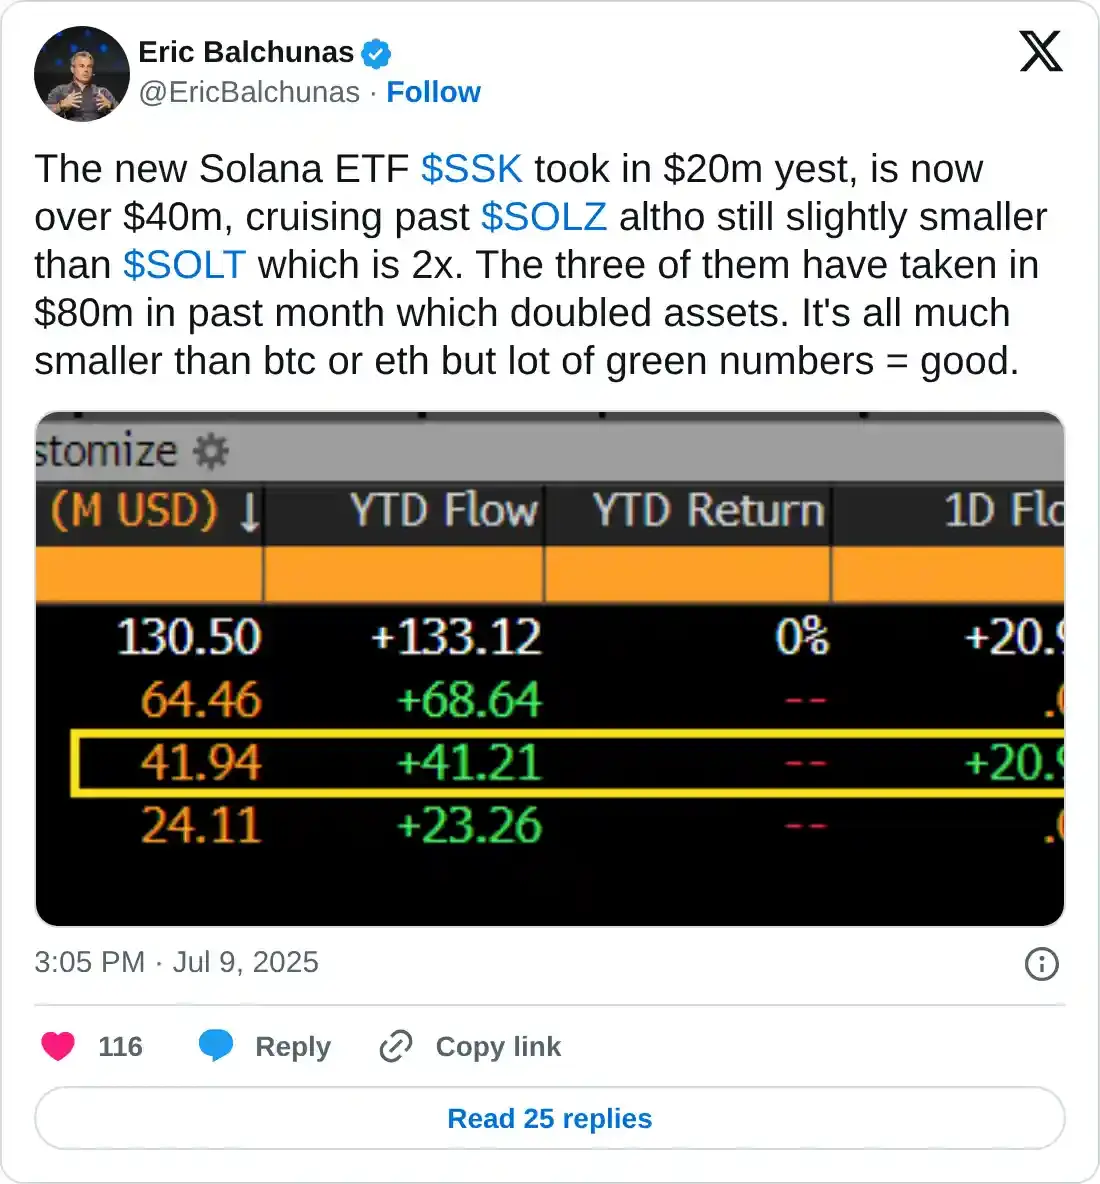
According to data shared by Bloomberg analyst Eric Balchunas, the SSK ETF recorded approximately $20 million on its first day of trading, with the inflow volume surpassing $80 million on Wednesday.
While the inflow volume is much smaller than that recorded by Bitcoin (BTC) and Ethereum (ETH) spot ETFs on their initial trading days, Balchunas said that SSK volume is performing well, with a lot of figures in the green.
Meanwhile, the Securities & Exchange Commission (SEC) has recently hinted at the possibility of approving spot Solana ETFs after reportedly developing a framework to fast-track the process of listing new products.
Technical outlook: Solana offers bullish signals
Solana price's technical picture is gradually turning bullish after breaking above a descending channel, shown on the daily chart below. The price increase has influenced a surge in risk-on sentiment, as traders shrug off of macroeconomic uncertainty surrounding tariff developments in the US.
Solana currently holds above the support provided by the 100-day Exponential Moving Average (EMA) currently at $153 and the 50-day EMA slightly below at $151.
Traders could continue to seek exposure nudged by the Moving Average Convergence Divergence (MACD) indicator, which has maintained a buy signal since June 27. This signal occurs when the blue MACD line crosses above the red signal line.
A potential daily close above the 100-day EMA at $153 could reinforce the bullish grip and increase the probability of the uptrend’s extension above the 200-day EMA, currently at $158.
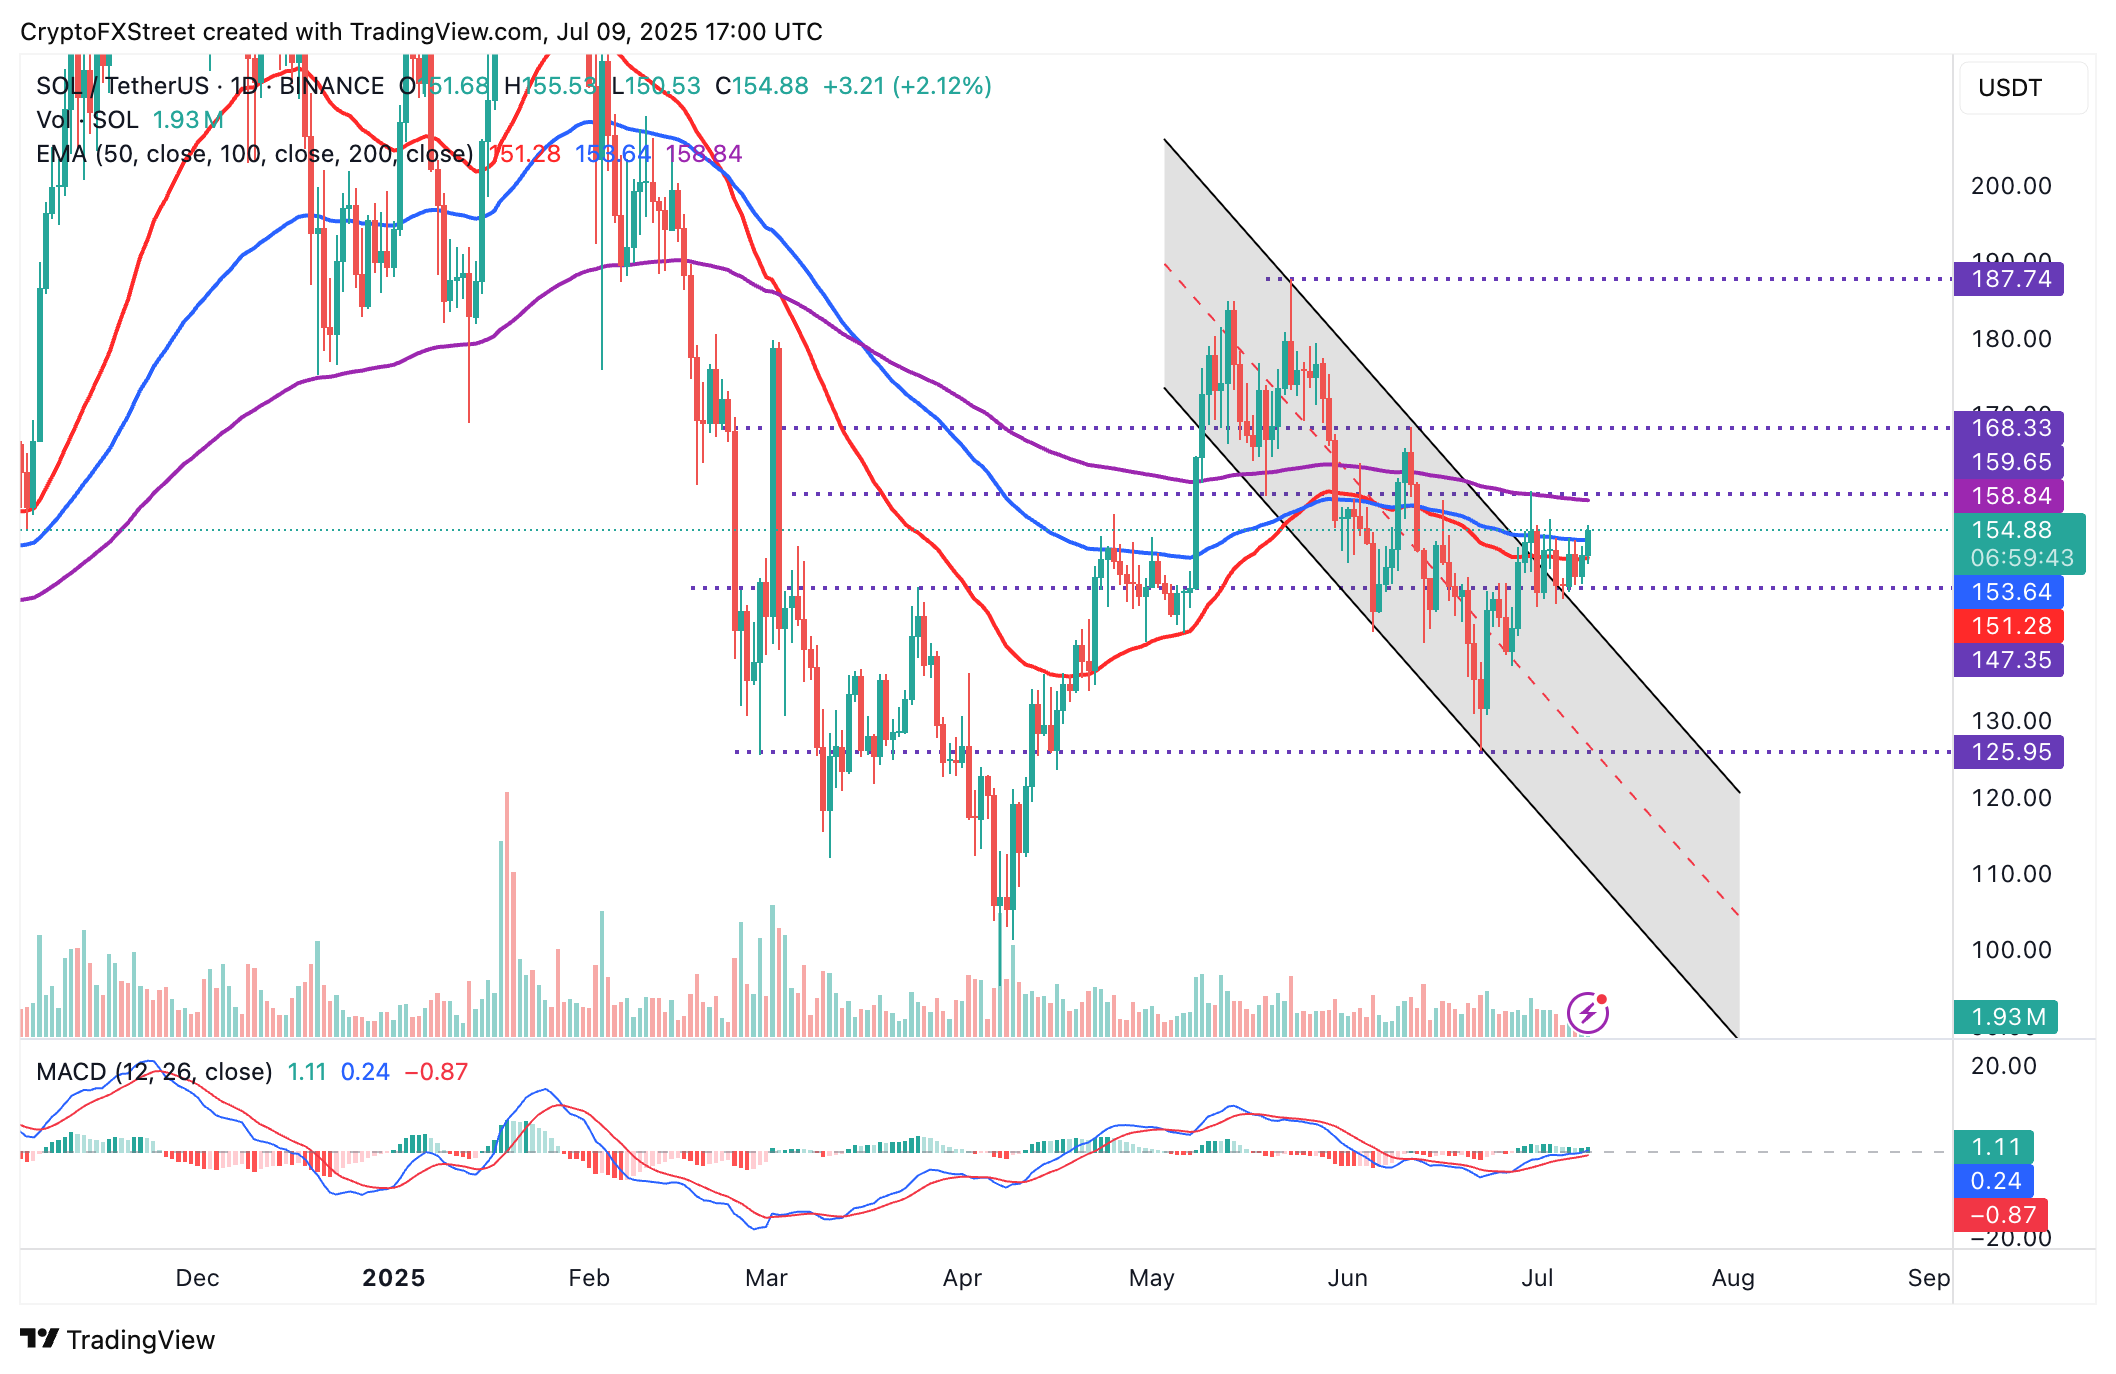
SOL/USDT daily chart
Still, traders should be aware of the macroeconomic uncertainty and prepare accordingly in case of a sudden volatility spike that could trigger a trend reversal. Beyond the 100-day EMA and the 50-day EMA, other tentative support areas lie around $147, tested on Tuesday, and $125, which was probed on June 22.
Open Interest, funding rate FAQs
Higher Open Interest is associated with higher liquidity and new capital inflow to the market. This is considered the equivalent of increase in efficiency and the ongoing trend continues. When Open Interest decreases, it is considered a sign of liquidation in the market, investors are leaving and the overall demand for an asset is on a decline, fueling a bearish sentiment among investors.
Funding fees bridge the difference between spot prices and prices of futures contracts of an asset by increasing liquidation risks faced by traders. A consistently high and positive funding rate implies there is a bullish sentiment among market participants and there is an expectation of a price hike. A consistently negative funding rate for an asset implies a bearish sentiment, indicating that traders expect the cryptocurrency’s price to fall and a bearish trend reversal is likely to occur.
Author

John Isige
FXStreet
John Isige is a seasoned cryptocurrency journalist and markets analyst committed to delivering high-quality, actionable insights tailored to traders, investors, and crypto enthusiasts. He enjoys deep dives into emerging Web3 tren


