Bitcoin Price Forecast: BTC steady around $108,000 as investors await FOMC minutes for Fed rate clues
- Bitcoin price holds steady at around $108,000 on Wednesday, maintaining support at a key technical level.
- Investors' attention shifts to the FOMC meeting minutes, as it offers insights into the Fed’s interest rate path prospects.
- Trump Media files for approval of five crypto ETFs with the SEC, while spot Bitcoin ETFs record $80 million in inflows on Tuesday.

Bitcoin (BTC) holds steady at around $108,000 at the time of writing on Wednesday as investors adopt a cautious stance ahead of the Federal Reserve’s (Fed) meeting minutes release. In the absence of any relevant market-moving news, market participants are closely watching for signals on the Fed’s potential rate-cut path.
The development of Exchange Traded Funds (ETFs) added short-term optimism for the largest cryptocurrency by market capitalization, as Trump Media files for five crypto ETFs, while spot Bitcoin ETFs recorded $80 million in inflows on Tuesday.
FOMC meeting minutes could trigger volatility for BTC
Bitcoin continues to trade sideways, around $108,000 during the European session on Wednesday. The lack of any relevant market-moving news has caused a consolidation in BTC so far this week. However, this consolidation could come to an end during the American trading session as the Federal Open Market Committee (FOMC) meeting minutes are released late Wednesday, which will provide more cues about the Fed’s interest rate path. This, in turn, will drive and provide a fresh directional impetus to the top cryptocurrency by market capitalization.
According to a K33 Research report released on Tuesday, BTC has remained rangebound with low day-to-day volatility since May 22, leading to a significant decline in implied volatility across options in the derivatives market.
Despite BTC’s push higher, the graph below shows that implied volatilities remain at yearly lows after another week of modest activity. BTC’s general lack of direction continues to enforce a neutral directional bias in options, as skews remain near neutral across tenors, suggesting a “wait-and-see” stance among traders.
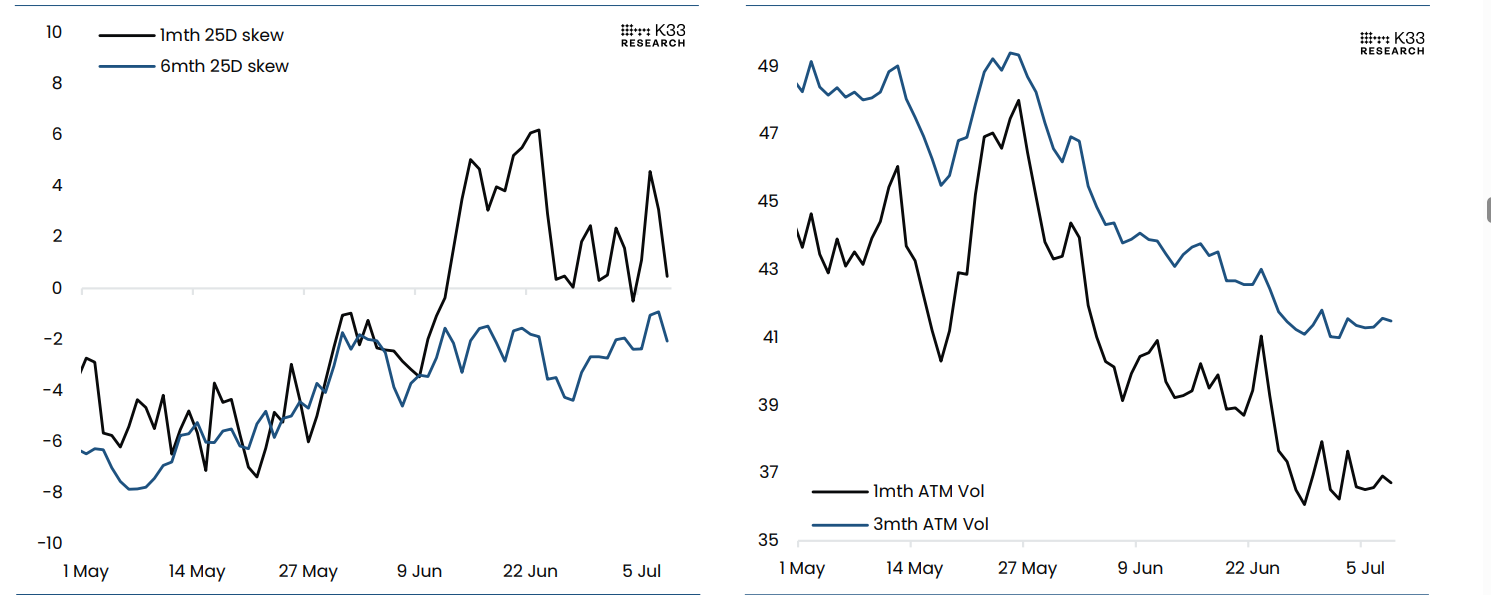
BTC skew chart (Left) BTC implied volatility chart (Right) Source: K33 Research
Trump’s company files for “Crypto Blue Chip ETF” with the US SEC
US President Donald Trump’s Trump Media Group filed an S-1 registration statement with the US Securities and Exchange Commission (SEC) on Tuesday to launch a “Crypto Blue Chip ETF” for five assets, including Bitcoin, Ethereum (ETH), Solana (SOL), Cronos (CRO) and Ripple (XRP).
This ETF fund aims to allocate 70% of its assets to BTC, while 15%, 8%, 5%, and 2% are allocated to ETH, SOL, CRO, and XRP, respectively.
The approval of this fund would signal a bullish outlook for cryptocurrencies — especially for Bitcoin, given its maximum allocation — by boosting broader adoption and improving liquidity for the asset.
Apart from the demand from corporate companies, the institutional investors’ demand for BTC also remains robust. SoSoValue data show that spot Bitcoin ETFs recorded an inflow of $80.08 million on Tuesday, continuing its four-day streak of inflow since July 2.
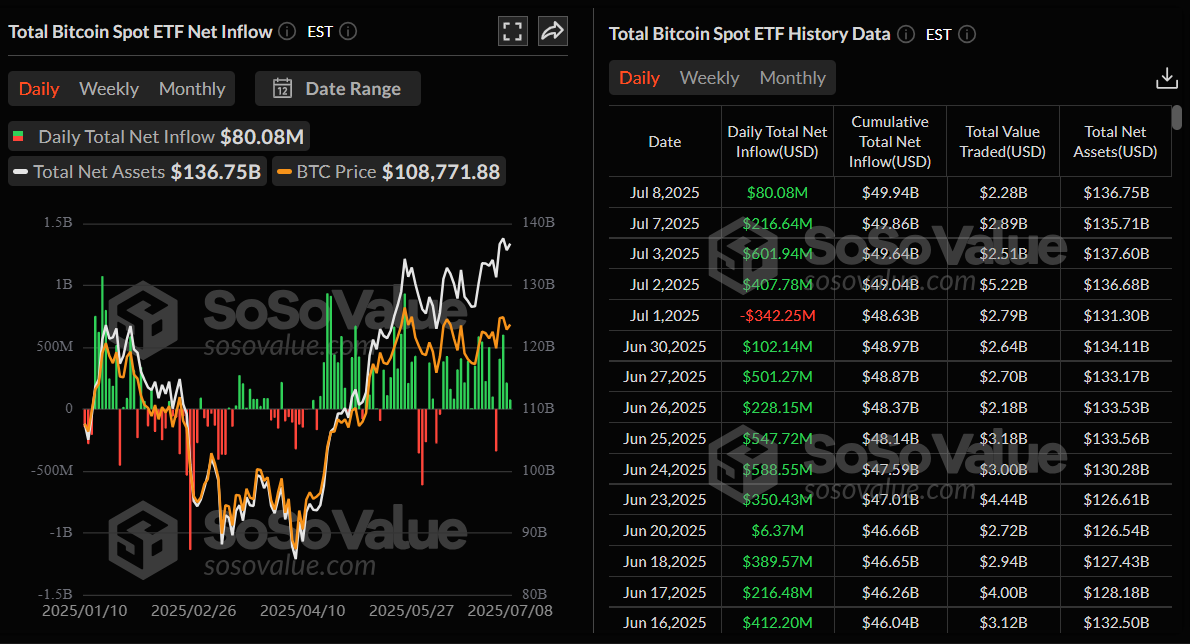
Total Bitcoin spot ETF net inflow daily chart. Source: SoSoValue
Bitcoin Price Forecast: BTC holds strong around $108,000 support level
Bitcoin price has been consolidating around the upper boundary of a previously broken consolidation zone at $108,355 since Friday. On Monday, it dipped slightly and retested this support level, recovering slightly the next day. At the time of writing on Wednesday, it trades down at around $108,700.
If the support level at $108,355 continues to hold, BTC could extend the rally toward the May 22 all-time high at $111,980.
The Relative Strength Index (RSI) on the daily chart reads 55, above its neutral level of 50, indicating bullish momentum. The Moving Average Convergence Divergence (MACD) lines on the daily chart coil against each other, indicating indecisiveness among traders.
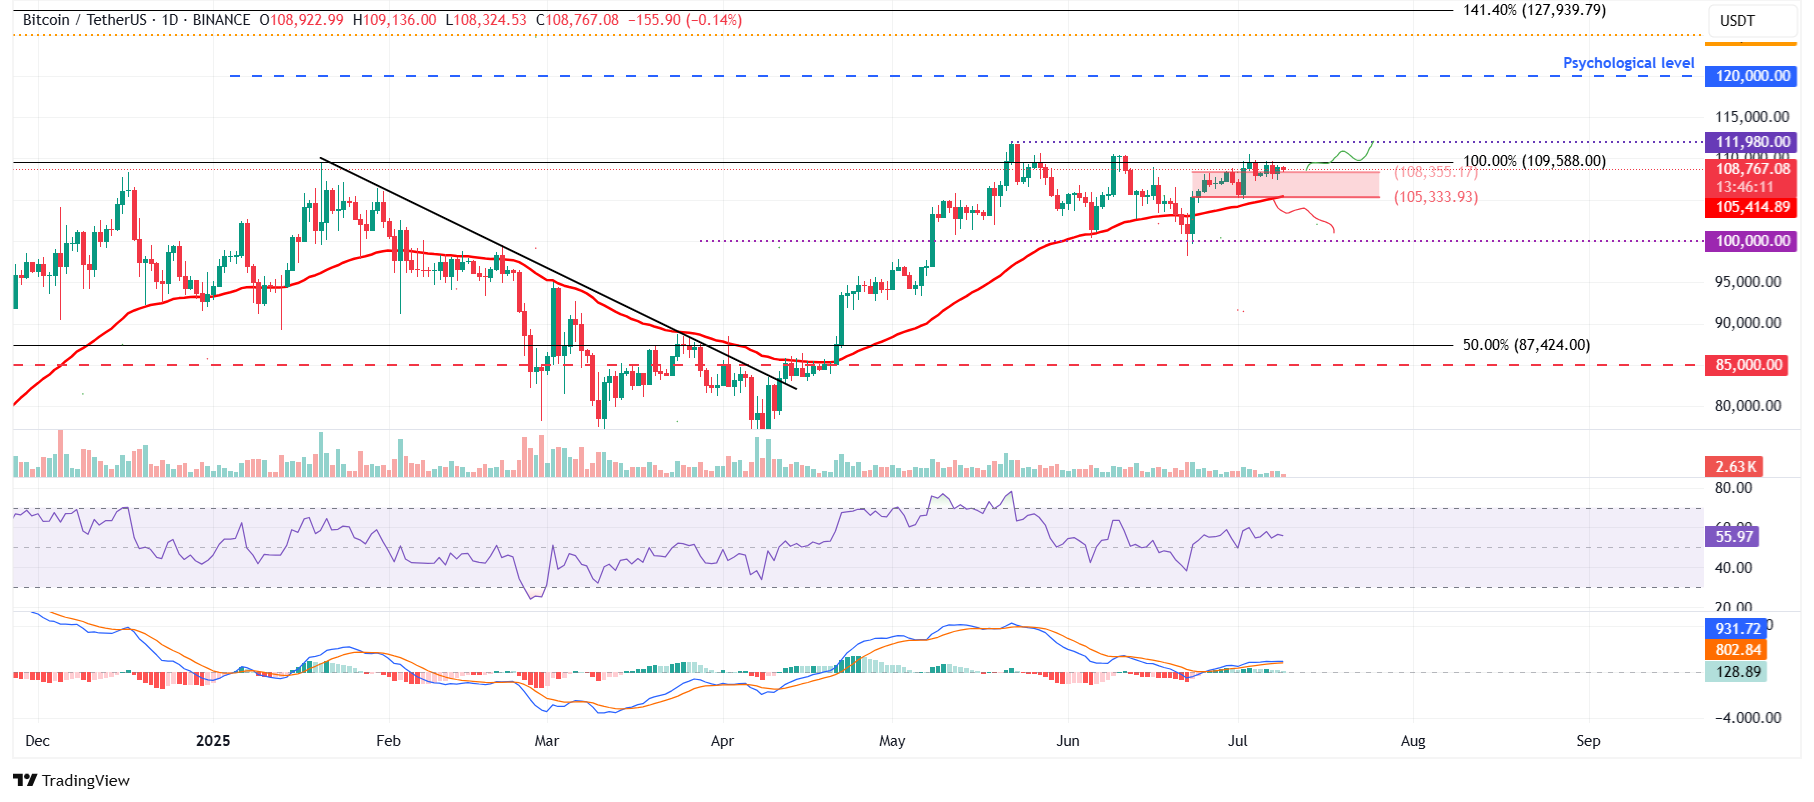
BTC/USDT daily chart
If BTC faces a correction and closes below its support at $108,355, it could extend the decline to retest the lower boundary of the consolidation zone at $105,333, which roughly coincides with the 50-day Exponential Moving Average (EMA) at $105,414, making this a key support zone for BTC.
Author

Manish Chhetri
FXStreet
Manish Chhetri is a crypto specialist with over four years of experience in the cryptocurrency industry.




