Solana price slips as Canadian Sol Strategies files with US SEC to list on NASDAQ
- Solana's downtrend extends, testing ascending channel support at around $145.
- Canadian Sol Strategies, boasting 420,000 SOL, seeks US SEC approval to list on NASDAQ.
- Solana derivative's long-to-short ratio leans bearish as liquidations reach $8 million over the last 24 hours.

Solana (SOL) price upside action stays subdued, leaving the smart contracts token vulnerable to downside risks. SOL is trading at $145 at the time of writing on Thursday, weighed down by elevated risks in the derivatives market.
Multiple technical indicators maintain a firm bearish bias, bringing tentative support levels at $135 and $125 into sight.
Canadian Sol Strategies eyes NASDAQ listing
The Canadian Stock Exchange-listed Sol Strategies (CYFRF) has filed with theUS Securities & Exchange Commission (SEC) seeking a listing on the NASDAQ stock exchange.
According to the filing, under Form 40-F, Sol Strategies' common shares will be listed under the ticker STKE if approved. The Ontario-based firm trades on the Canadian Securities Exchange under the symbol HODL.
Sol Strategies is one of the early adopters of Solana-based treasury funds. The company boasts over 420,000 SOL valued at approximately $61 million, whereby 269,258 SOL are directly owned, while 268,671 SOL are held in staking contracts linked to the firm's validators.
In addition to supporting its validator operations, Sol Strategies' $500 million in funding, secured in April through the issuance of convertible notes, will be used to accumulate Solana.
Technical outlook: Solana is on the cusp of another breakdown
Solana's price upside movement remains muted despite Sol Strategies' move to seek a listing on the NASDAQ exchange, which, if approved, would expose the company to US investors.
The ascending channel's lower boundary support at around $145 is limiting potential losses. However, odds are in favor of an extended pullback, backed by a sell signal from the Moving Average Convergence Divergence (MACD) indicator. This signal, which often encourages traders to reduce exposure to SOL, has been maintained since May 18, when the blue MACD line crossed below the red signal line.
The Relative Strength Index (RSI) downtrend, which is below the 50 midline, reinforces the bearish grip. A continued movement toward oversold territory would indicate bearish momentum and increase the probability of losses lasting longer than expected.
Tentative areas to monitor include $135, which was tested as support in April and February, as well as $125, which was tested in April and September 2024.
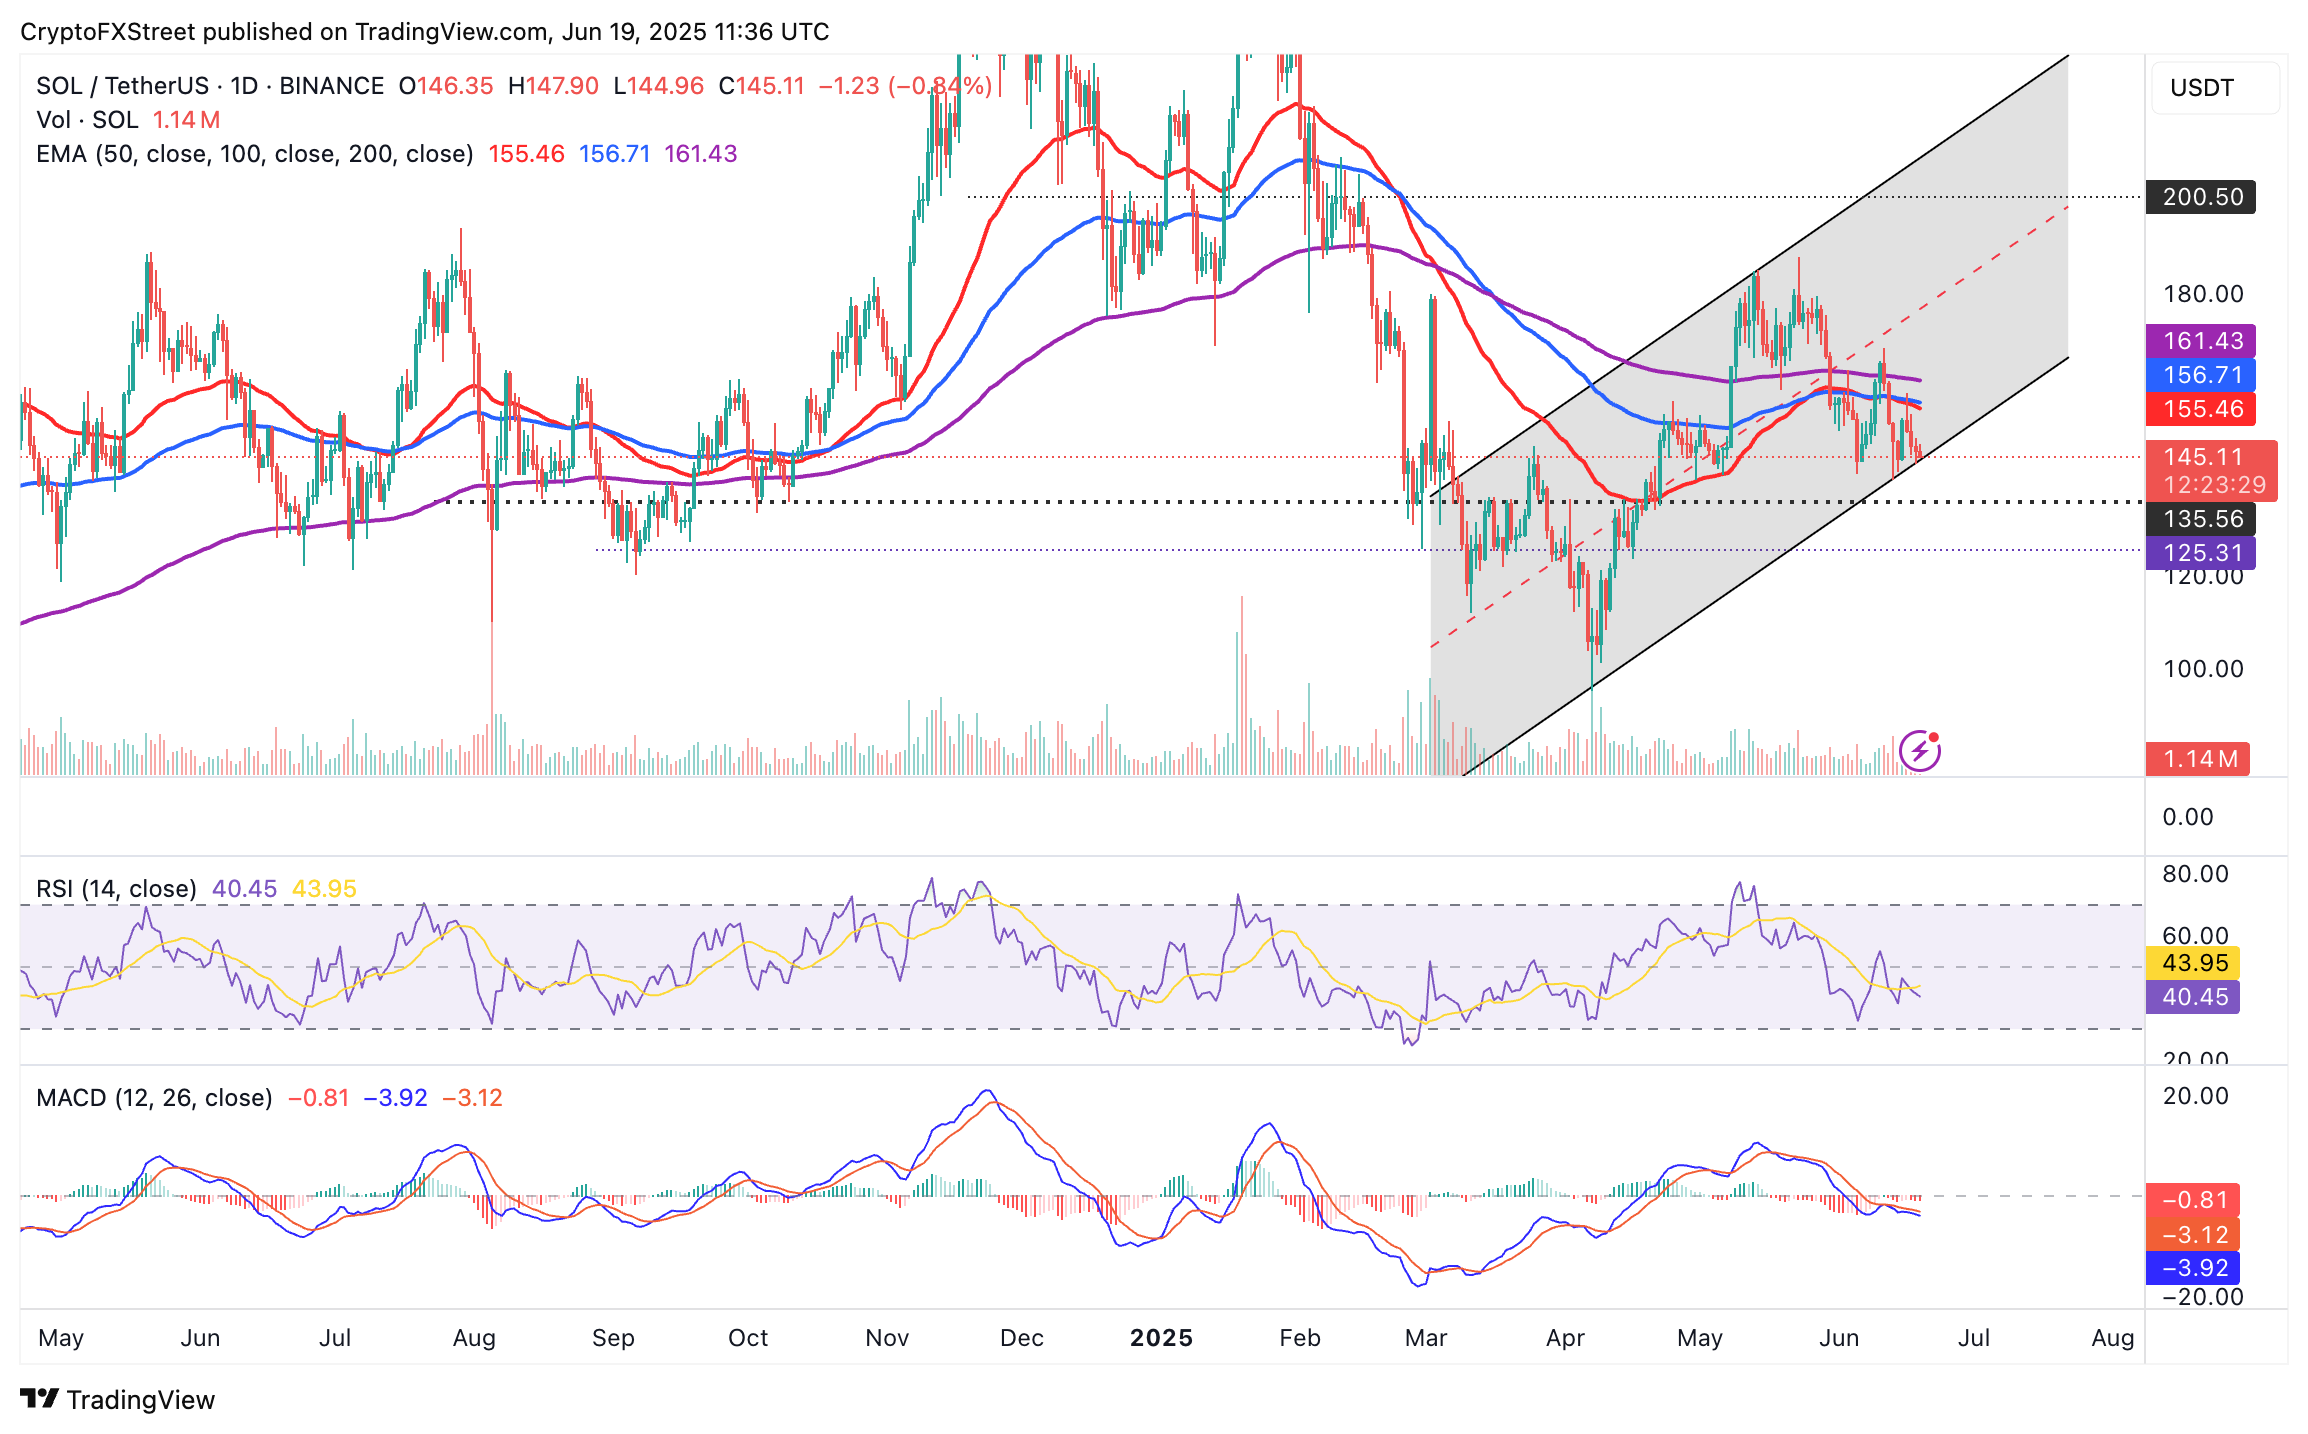
SOL/USD daily chart
On the other hand, Solana's derivatives market is on the edge, facing elevated risk, with the long-to-short ratio (0.9853) maintaining a bearish bias. Despite a minor increase in the Open Interest (OI) to $6.6 billion, a surge in long positions liquidations to $6 million in the last 24 hours highlights an upside-heavy structure likely to prolong the downtrend.
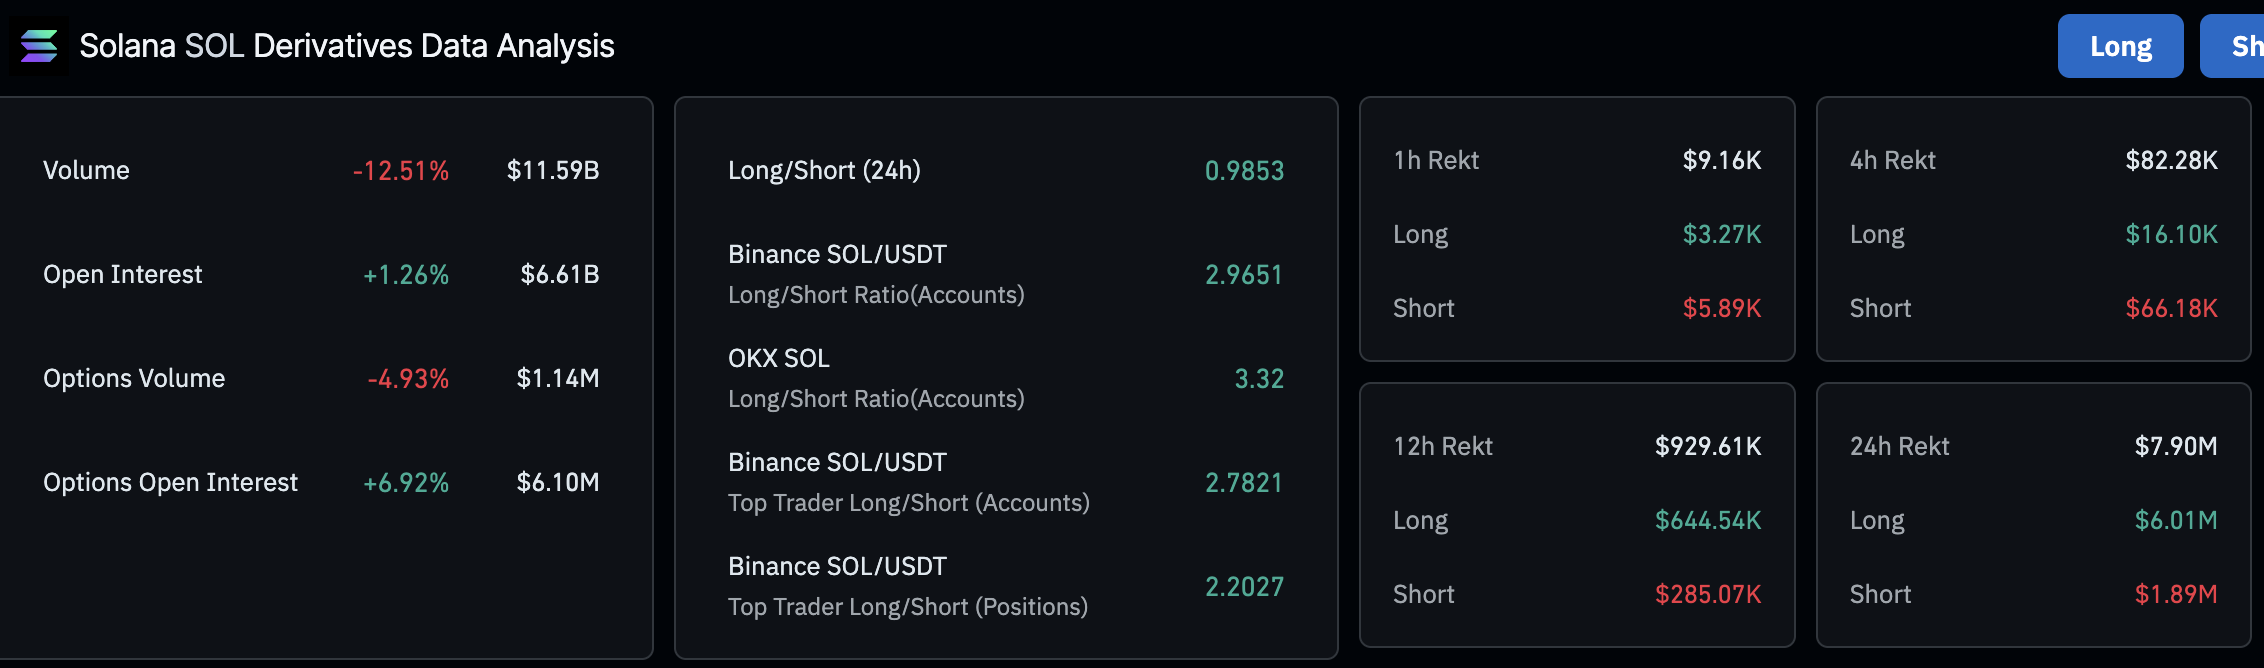
Solana derivatives stats | Source: CoinGlass
An 11.5% decrease in volume to $11.6 billion suggests declining trading activity and a lack of conviction among traders. If the SOL price rebounds from the lower boundary of the ascending channel's support, sentiment and risk appetite could improve, increasing the chances of a recovery aiming for highs above the 200-day Exponential Moving Average (EMA), currently at $161.
Open Interest, funding rate FAQs
Higher Open Interest is associated with higher liquidity and new capital inflow to the market. This is considered the equivalent of increase in efficiency and the ongoing trend continues. When Open Interest decreases, it is considered a sign of liquidation in the market, investors are leaving and the overall demand for an asset is on a decline, fueling a bearish sentiment among investors.
Funding fees bridge the difference between spot prices and prices of futures contracts of an asset by increasing liquidation risks faced by traders. A consistently high and positive funding rate implies there is a bullish sentiment among market participants and there is an expectation of a price hike. A consistently negative funding rate for an asset implies a bearish sentiment, indicating that traders expect the cryptocurrency’s price to fall and a bearish trend reversal is likely to occur.
Author

John Isige
FXStreet
John Isige is a seasoned cryptocurrency journalist and markets analyst committed to delivering high-quality, actionable insights tailored to traders, investors, and crypto enthusiasts. He enjoys deep dives into emerging Web3 tren


