Solana develops bear trap giving SOL fuel to launch towards $300
- Solana price shows signs that a bottom may be in.
- A bear trap pattern is developing on the $2.50/3-box reversal Point and Figure Chart.
- Multiple buy opportunities in development.

Solana price has completed a technical corrective move by retracing a little more than 28% of its value from the all-time high. As a result, consolidation may occur for the remainder of the week until equilibrium is reestablished between price and time.
Solana price positioned for multiple bullish breakout options
Solana price has several signals showing that bullish price action may return for Solana. The Point and Figure image below shows a powerful short setup with a breakout below a triple-bottom. Additionally, that short entry confirmed the existence of a bull trap.
Combining those two factors creates one of the most potent Point and Figure combinations for a short entry. However, the expected sell-off has not occurred. Instead, sellers appear unable or unwilling to move Solana price lower.
This apprehension by sellers gives buyers an opportunity. There are two long setups in development. The first (label A) is a hypothetical buy stop order at $207.50, a stop loss @ $197.50 and a profit target at $250. This entry confirms two bullish patterns in Point and Figure analysis: a Bear Trap and Bull Pole Pattern.
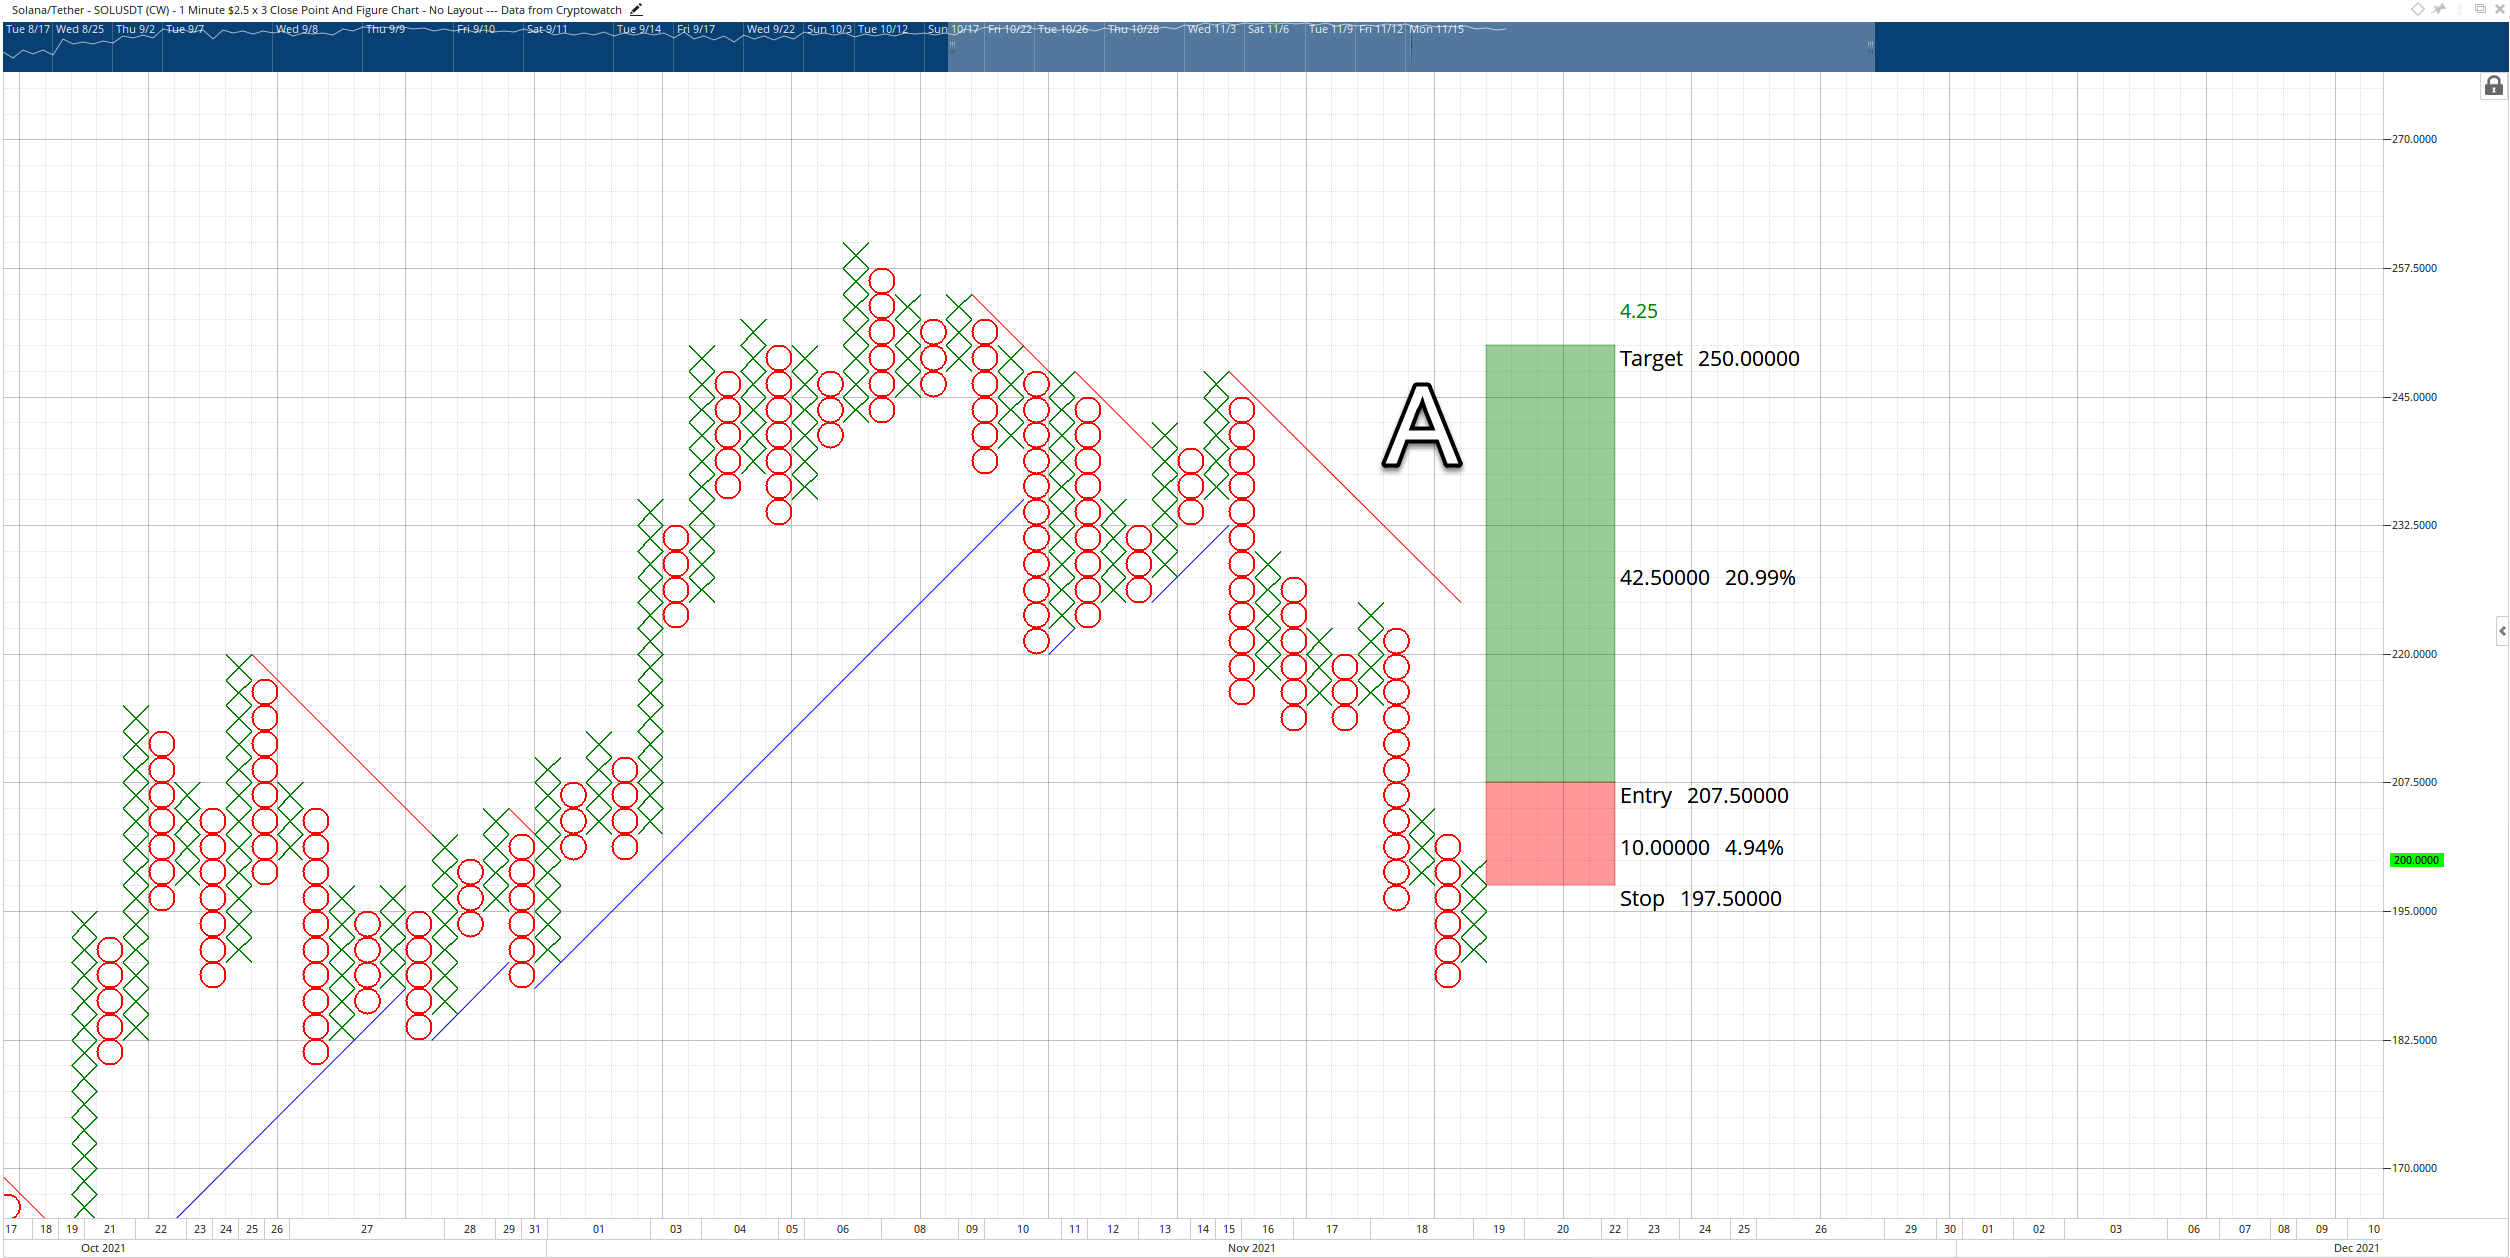
SOL/USDT $2.5/3-box Reversal Point and Figure Chart
The second theoretical long (label B) entry idea is a buy stop order at $195, a stop loss at $175 and a profit target at $250. The entry is based on a Spike Pattern, which requires at least fifteen Os in the current column. The buy stop order is placed only after Solana price has moved to at least $175.
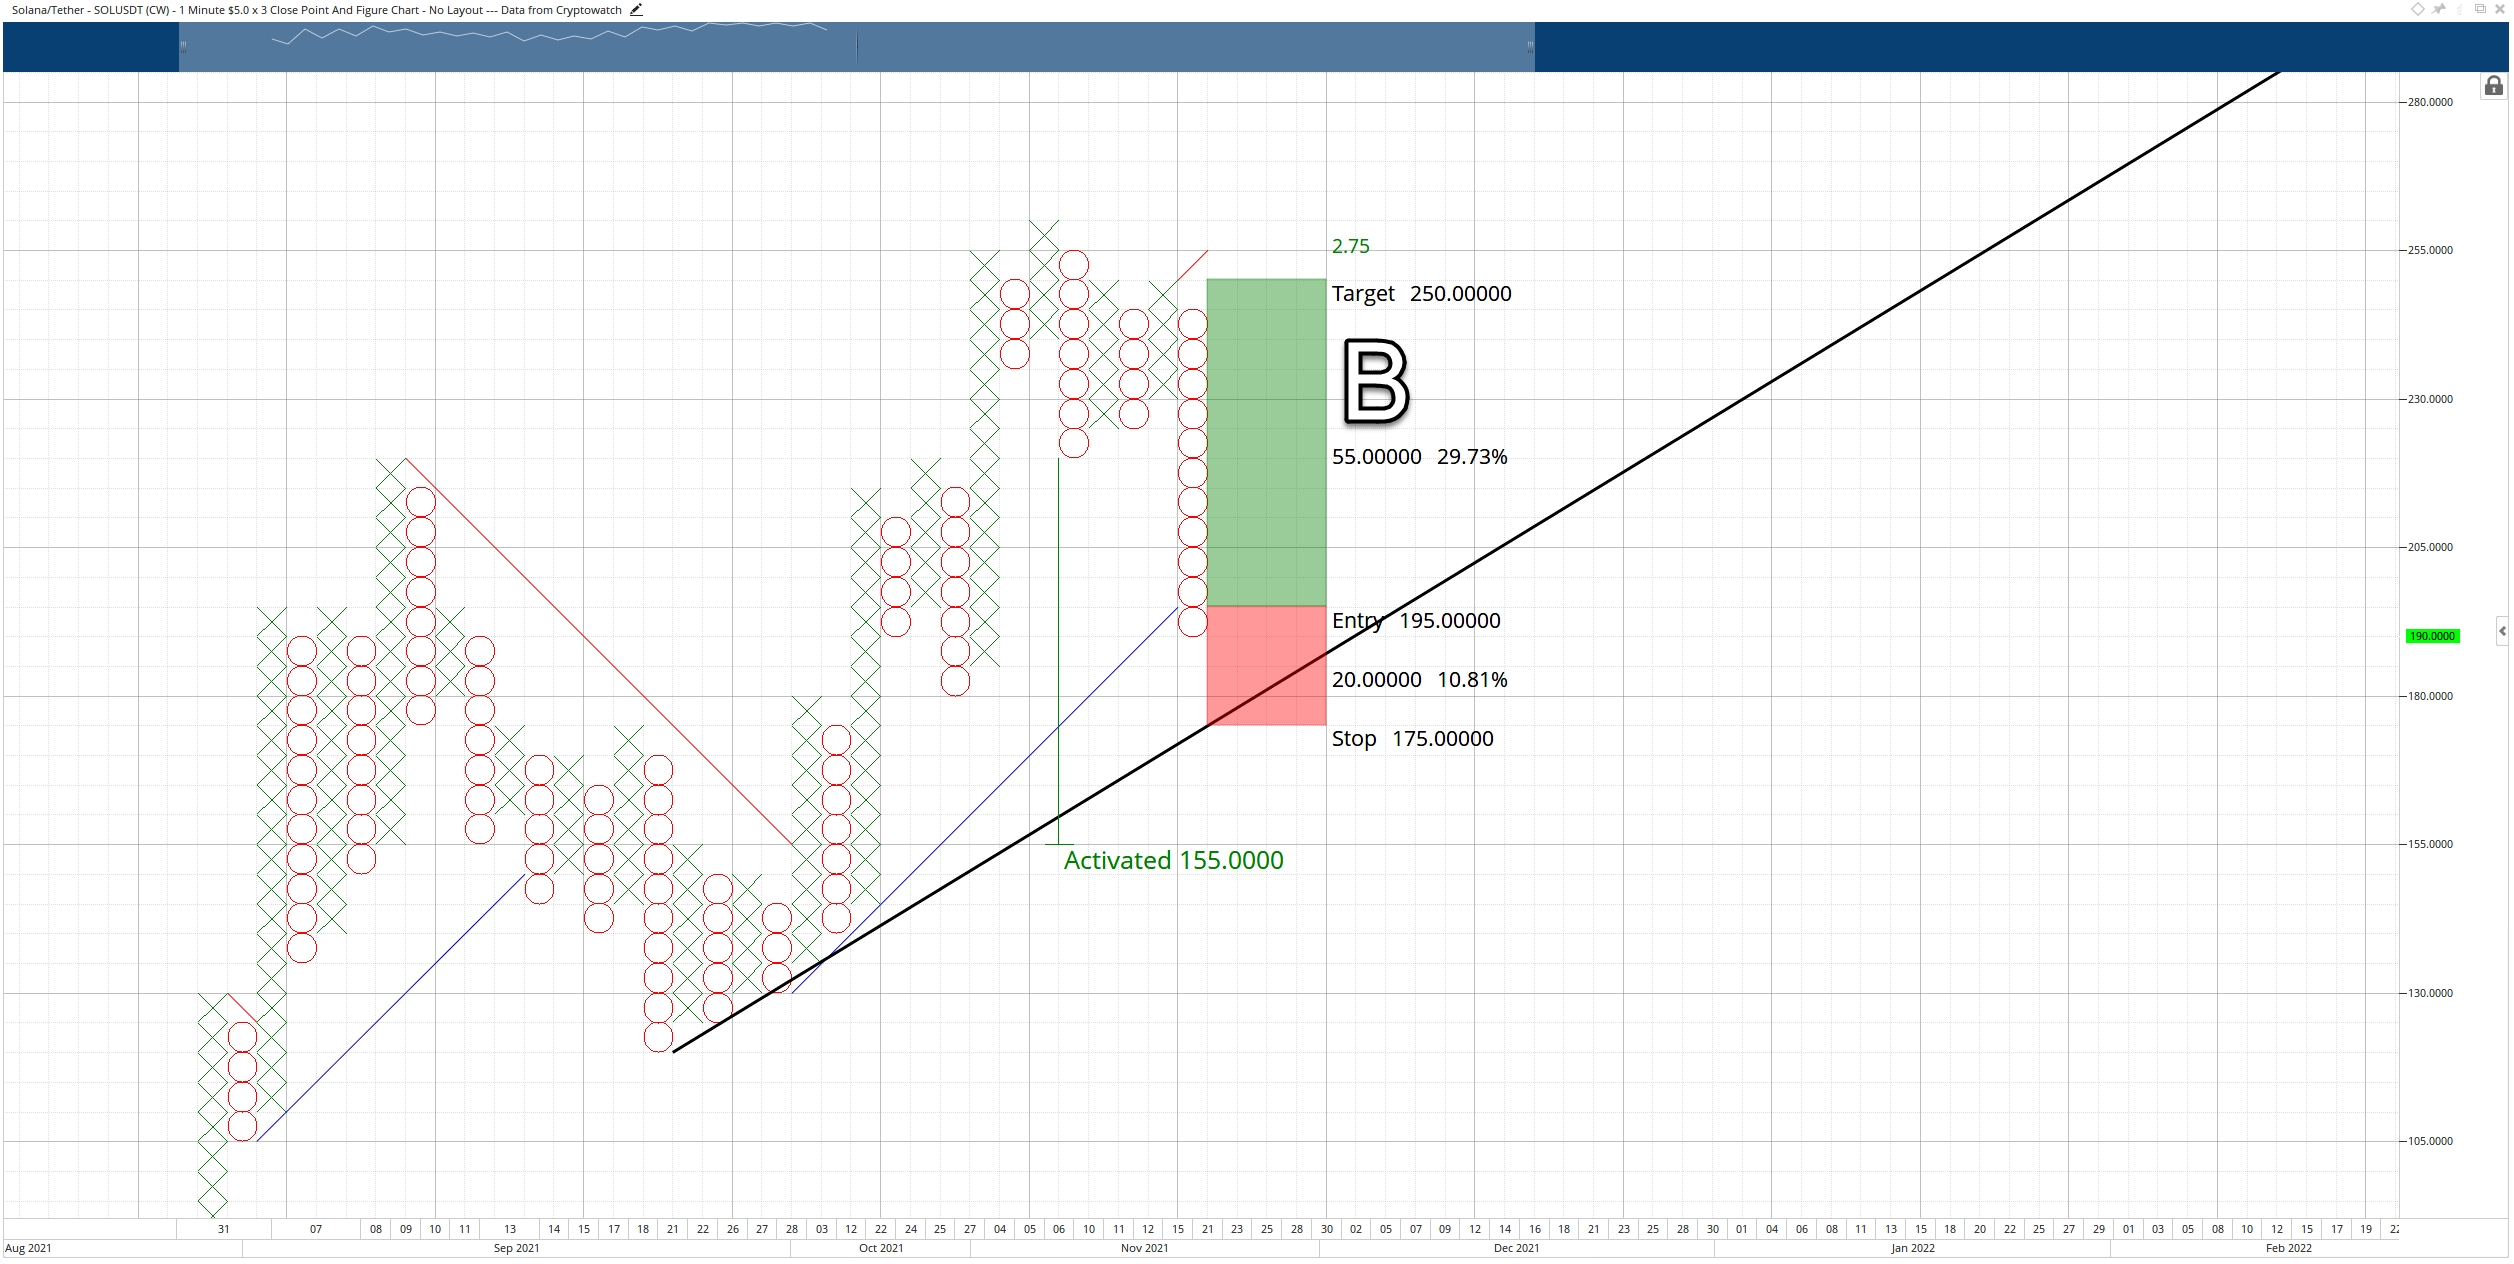
SOL/USDT $5.00/3-box Reversal Point and Figure Chart
The long ideas presented will be invalidated if Solana price prints an O below the $170 level.
Author

Jonathan Morgan
Independent Analyst
Jonathan has been working as an Independent future, forex, and cryptocurrency trader and analyst for 8 years. He also has been writing for the past 5 years.
More from Jonathan Morgan


