Solana price eyes 15% pullback as institutions slow down investment in SOL
- Solana price is hovering above the 50% retracement level at $216, hinting at a move lower.
- A downswing is likely to knock SOL down to sweep the range low at $186.
- A daily close above $246 will invalidate the bullish thesis.

Solana price is consolidating around the trading range’s midpoint, suggesting it could follow the general trend and head lower. This move will reset the selling pressure and will allow buyers an opportunity to make a comeback.
SOL inflows depreciate week-over-week
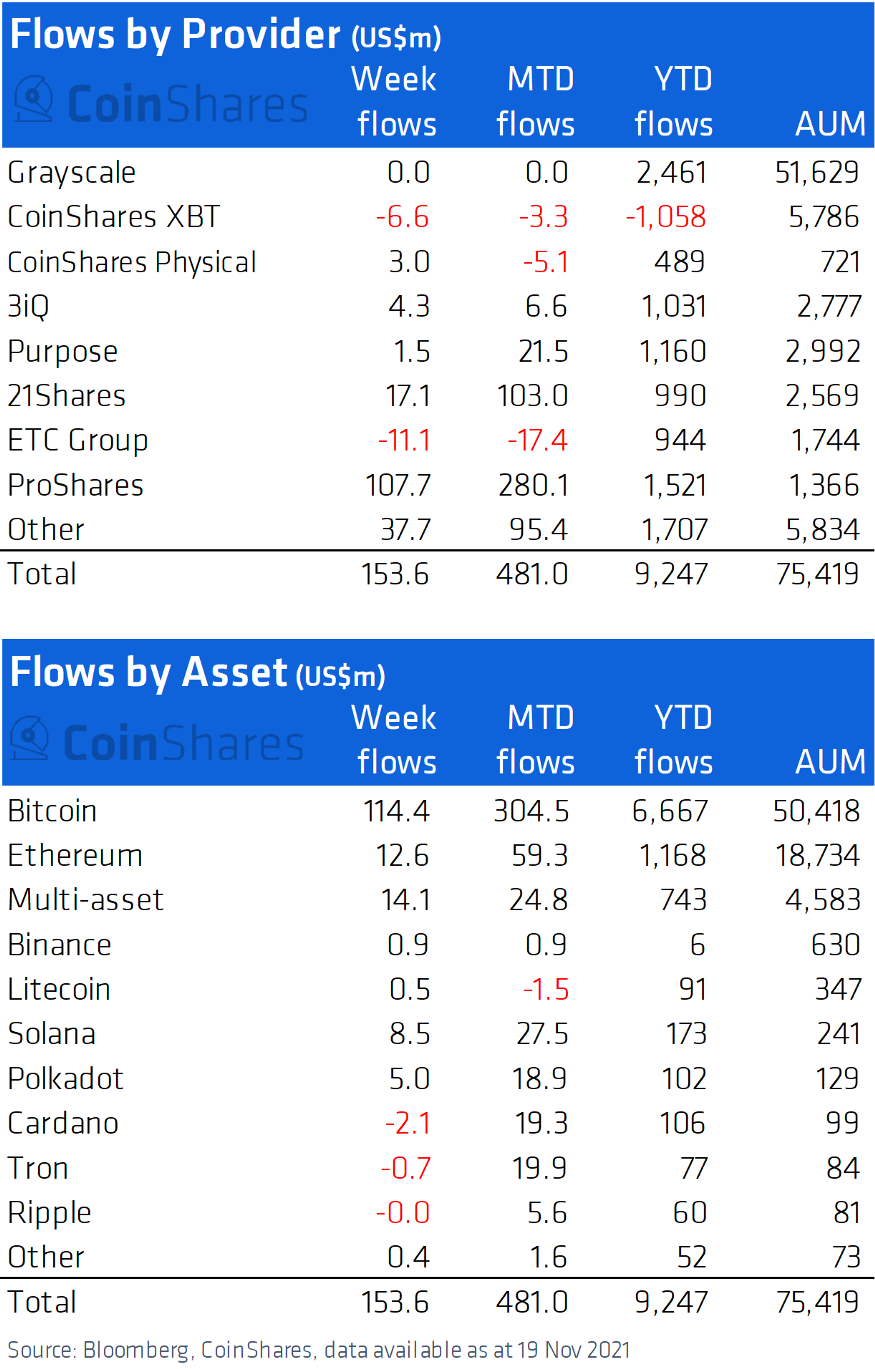
Institutional participants investing in Solana seem to have taken a hit over the course of the last two weeks, according to a recent report from CoinShares. Solana has seen a total inflow of $43 million over the last month. In contrast, Cardano saw a $2.1 million outflow.
While Bitcoin hogs the top spot, last week saw a decrease in the inflow from $9.8 million to $8.5 million. This 13.2% decline suggests that institutional investors are looking elsewhere.
Institutional inflows chart
Bitcoin seems to be attracting more eyes as the total inflows went from $97.5 million to $114.4 million. This 17.3% uptick suggests that interested parties could be looking to buy the dip.
Ethereum continues to dominate in the world computer category, with inflows last week totaling up to $12.6 million. Still, Ethereum-killer Solana seems to have siphoned off a majority of the interest as its inflow stands at $8.5 million.
While the monthly inflows remain primarily on the bullish side, the short-term outlook remains bearish, much similar to what the technicals indicate.
Solana price eyes lower support levels
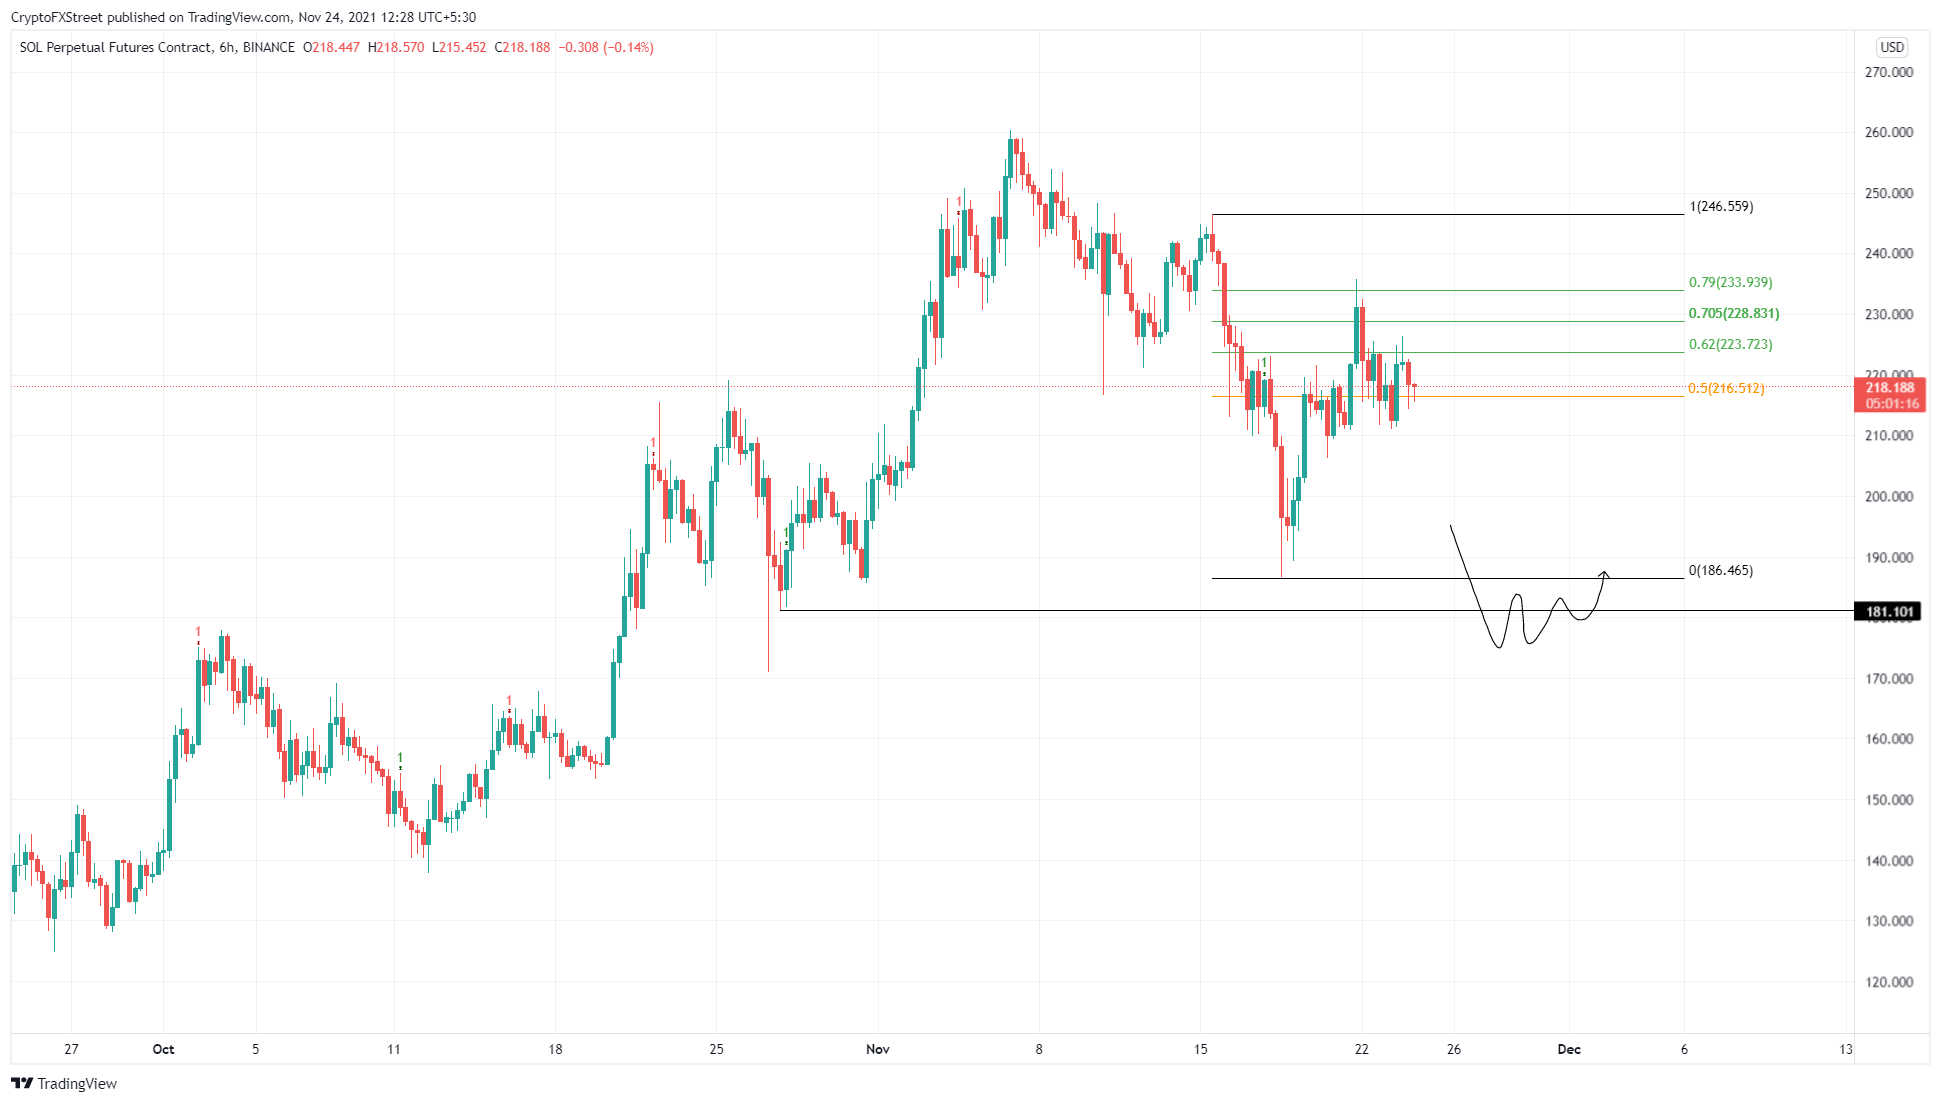
Solana price attempted a rally on November 18 to surpass the November 15 swing high at $246 but failed to do so. This move led to an 8% downswing to where SOL currently stands – $216. A breakdown of the 50% retracement level at $216 will trigger a downtrend and likely knock Solana price down to the range low at $186. This retracement could face a momentary pause at the $200 psychological level, but investors can expect SOL to dip below the range low at $186 to collect the ‘sell side’ liquidity.
In a special case scenario, investors can expect SOL to retest the 70.5% Fibonacci retracement level at $233 before it heads lower to shatter the $216 support barrier. Either way, a 15% downswing seems likely from the current position.
Therefore, market participants should pay close attention to the $216 support floor, which will make or break the situation.
SOL/USDT 6-hour chart
Regardless of the bearish narrative of the crypto market, if Solana price manages to move higher and produce a higher high above $233, it will indicate a weakness among buyers. However, a daily close above the range high at $246 will invalidate the bearish thesis.
In such a case, Solana price could continue its uptrend to retest the all-time high at $260.
Author

Akash Girimath
FXStreet
Akash Girimath is a Mechanical Engineer interested in the chaos of the financial markets. Trying to make sense of this convoluted yet fascinating space, he switched his engineering job to become a crypto reporter and analyst.



