Solana price eases sell-off, are bulls preparing to seize the moment?
- Solana price taps robust support at $30.00 amidst oversold conditions.
- SOL recovery is likely to delay due to the platform's declining development activity.
- The buyer congestion at $30.00 is crucial to the Solana price bullish structure; otherwise, the token may revisit lower support at $26.00.

Solana price is hovering above its most critical support area at $30.00. The competitive smart contracts token has been a bears' playing field over the last ten days. However, a bullish trend reversal is possible heading into the weekend if buyers regain confidence in the market.
Where is Solana price headed?
The area between $30.00 and $32.00 hosts an immense concentration of buyers. It has in the past absorbed selling pressure, thus allowing SOL to regain bullish momentum. For instance, Solana price moved 54% up after tapping this same support in early July.
Investors locked in another 27% gains after Solana price rallied to $36.72 at the beginning of September. These frequent rebounds from the same level imply that Solana price may have hit the same bottom level but as yet lacks a catalyst to trigger a substantial move north.
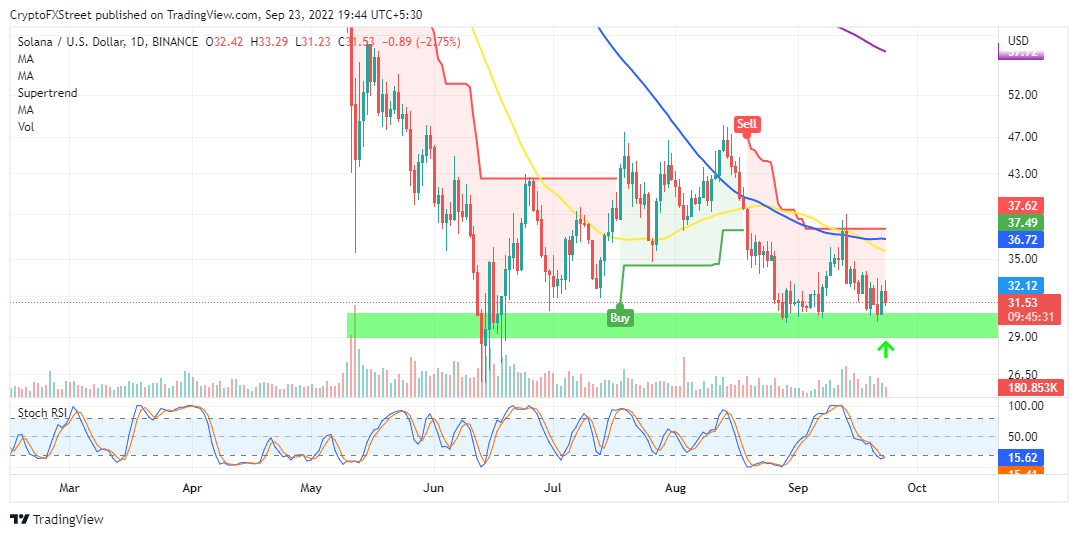
SOL/USD daily chart
Signals from the Stochastic RSI indicate that Solana price is fast becoming oversold. In other words, this could mark the tail end of the sell-off. If buy orders create demand for SOL between $30.00 and $32.00, a sharp move to $38.00 and $48.00 would not be a farfetched idea.
Traders searching for long positions must wait for the Stochastic RSI to lift from the oversold region before placing their orders to avoid bull traps or being stuck in an untradeable market. Keep in mind that the 50-day (yellow) Simple Moving Average (SMA) recently crossed below the longer-term 100-day SMA (blue). Although this pattern is not a typical death cross, its formation adds credence to the Solana price bearish technical outlook.
 [17.14.40, 23 Sep, 2022]-637995446985879063.png)
Solana Development Activity
Solana's development activity continues to drop for five months in a row, as shown by Santiment. This on-chain metric (Development Activity) tracks the number of pure development-related 'events" on the network's GitHub repository over time.
A continued downtrend in this metric indirectly shrinks demand for SOL because fewer developers are hosting and running new applications on the blockchain. Loosely interpreted – a low development activity deprives Solana price of bullish momentum to rally.
Author

John Isige
FXStreet
John Isige is a seasoned cryptocurrency journalist and markets analyst committed to delivering high-quality, actionable insights tailored to traders, investors, and crypto enthusiasts. He enjoys deep dives into emerging Web3 tren