Solana’s daily transactions exceed the Ethereum network’s in Q2
- According to Nansen’s quarterly report, Q2 noted as many as 40 million daily transactions in the case of Solana.
- The end of Q2 also witnessed the highest monthly sales of NFTs for Solana in almost five months, reaching $118 million.
- On the charts, SOL is struggling to escape the clutches of bears, keeping Solana close to the lows of $30.

Solana price rose to proficiency in 2021 when it was ranked among the best-performing assets, but the series of crashes that followed left it in the weeds. However, over the last couple of months, Solana seems to have carved some attention for itself, which is visible in the on-chain performance of the asset.
Solana takes over Ethereum
According to a report from Nansen, Solana observed significantly more transactions on a daily basis during the second quarter than Ethereum ever could.
All in all, over 40 million non-vote transactions were recorded, while in the case of Ethereum, only a little over 1.1 million transactions could be observed. Although the report highlighted that the volatility observed in the case of Ethereum was far lower than Solana, giving the former more stability.

Solana vs. Ethereum transactions
But the daily transactions weren’t the only front Solana noticed a growth on. In the case of NFTs, Solana had a pretty remarkable Q2. As a matter of fact, June recorded the highest NFT sales in almost five months, with Solana bringing in over $118 million.
Over the following months, the same volume dropped to less than $100 million and currently stands at just $85 million.
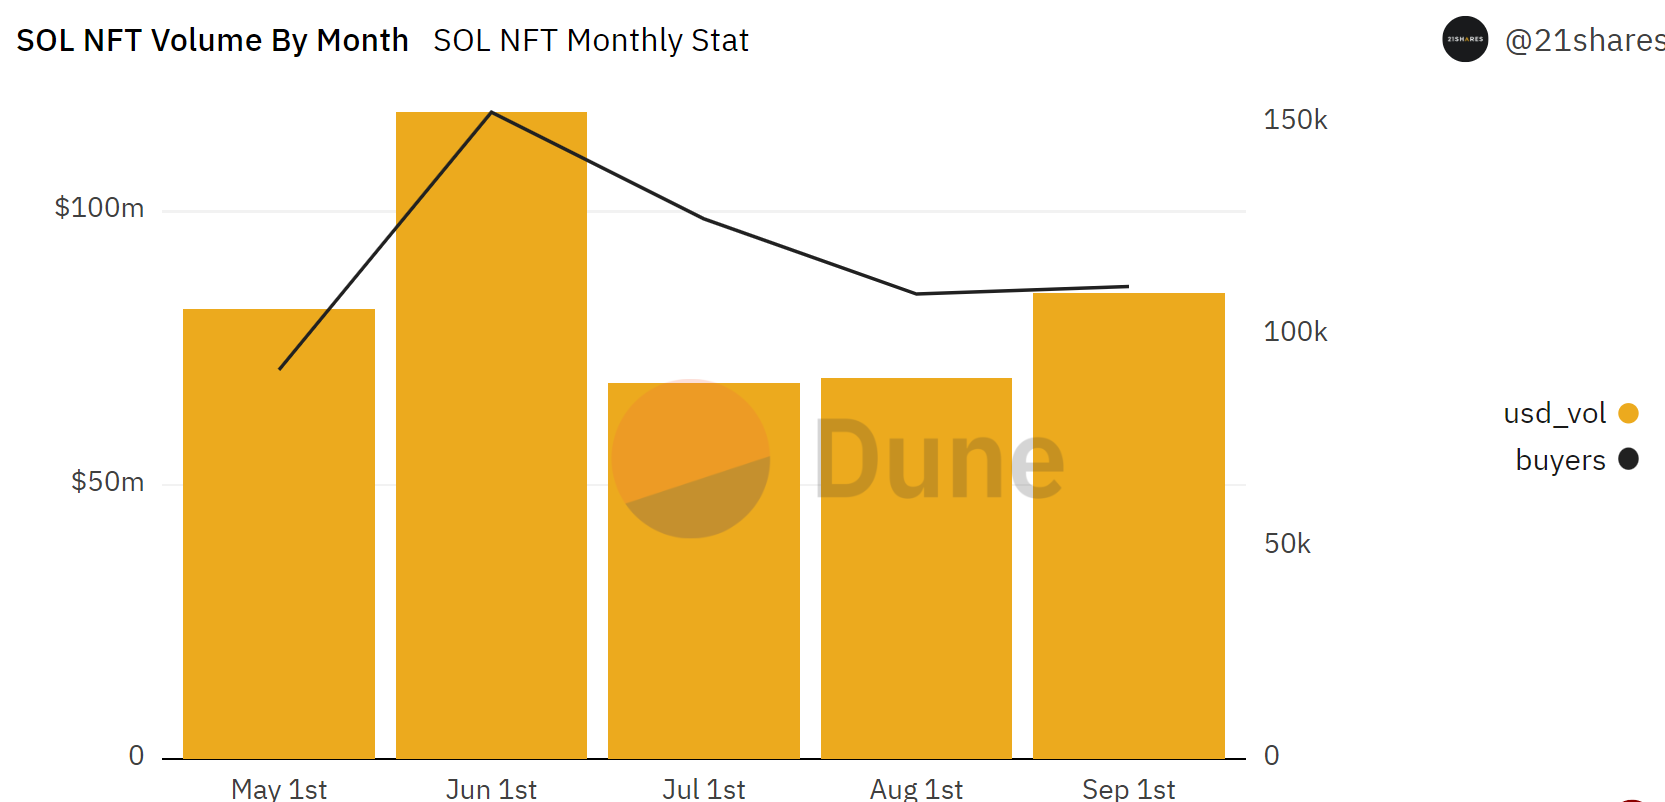
Solana NFT monthly sales volume
Solana makes no bang on the charts
Talking about the performance of Solana’s native token SOL, the second quarter hasn’t been favorable to investors. Throughout those three months, SOL went through multiple ups and downs before returning to the same price of $31, which was the lowest this year.
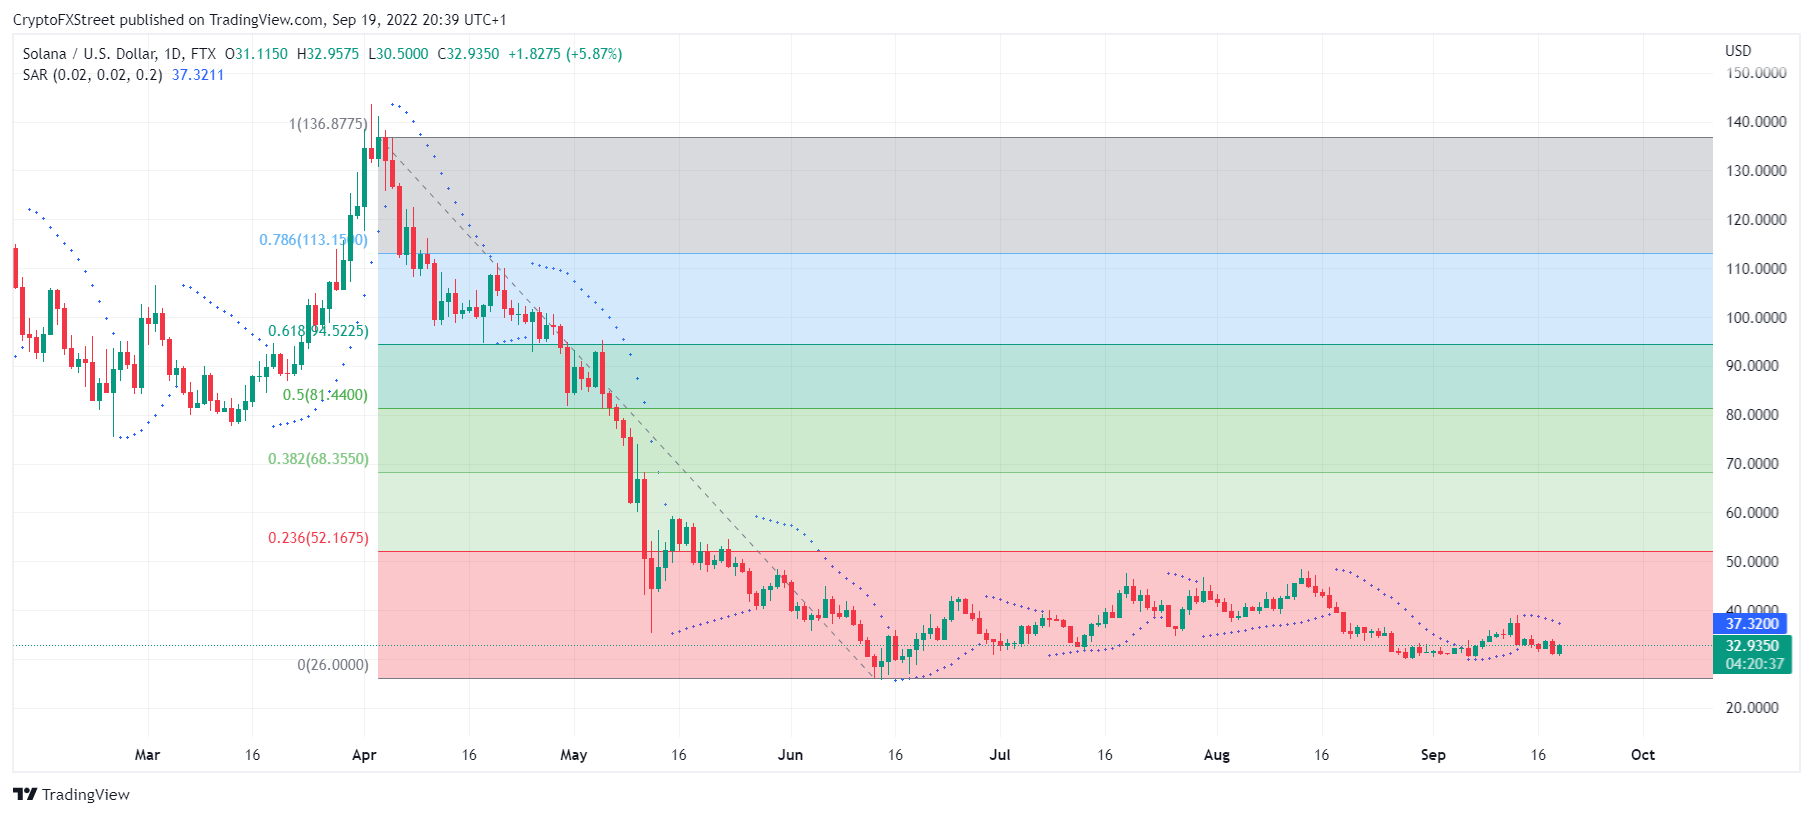
As it is, SOL is struggling to recover, and the added pressure from the bears is going to make it far more difficult for it going forward. The altcoin has been stuck below the 23.6% Fibonacci retracement of the $136-$26 decline, and might end up staying there, showing some restraints in the future as well.
Author

Aaryamann Shrivastava
FXStreet
Aaryamann Shrivastava is a Cryptocurrency journalist and market analyst with over 1,000 articles under his name. Graduated with an Honours in Journalism, he has been part of the crypto industry for more than a year now.


