Solana finds tentative support zone before SOL tests $115 as resistance
- Solana price finds much-needed support after dipping below the $100 value area.
- 2022 Volume Point Of Control gave bulls the lifeline they need to prevent collapse.
- Downside risks remain, but not until SOL hits $110

Solana price staved off another significant capitulation move – a condition it has been flirting with since late January 2022. The recent collapse below the $100 price level enticed a large number of longs to leave their positions and new short-sellers to enter near the bottom. If support holds, Solana will begin its road to $144, but it first needs to test $115.
Solana price is poised to hit $144, but it must break resistance at $115
Solana price has the single most extensive collection of resistance levels ahead of it above $110. The $115 area contains the following technical levels:
- 111.50 – 38.2% Fibonacci retracement
- 112.50 – daily Kijun-Sen
- 112.50 – bottom of the bull flag (blue diagonal linear regression channel)
- $113 – high volume node
- $116.60 – former 100% Fibonacci expansion
A positive development for Solana price bulls is the Composite Index oscillator returning to neutral conditions after reaching historical highs. Additionally, the Optex Bands dropped below the overbought zone, and the Relative Strength Index remains above the first oversold level in bear market conditions at 30.
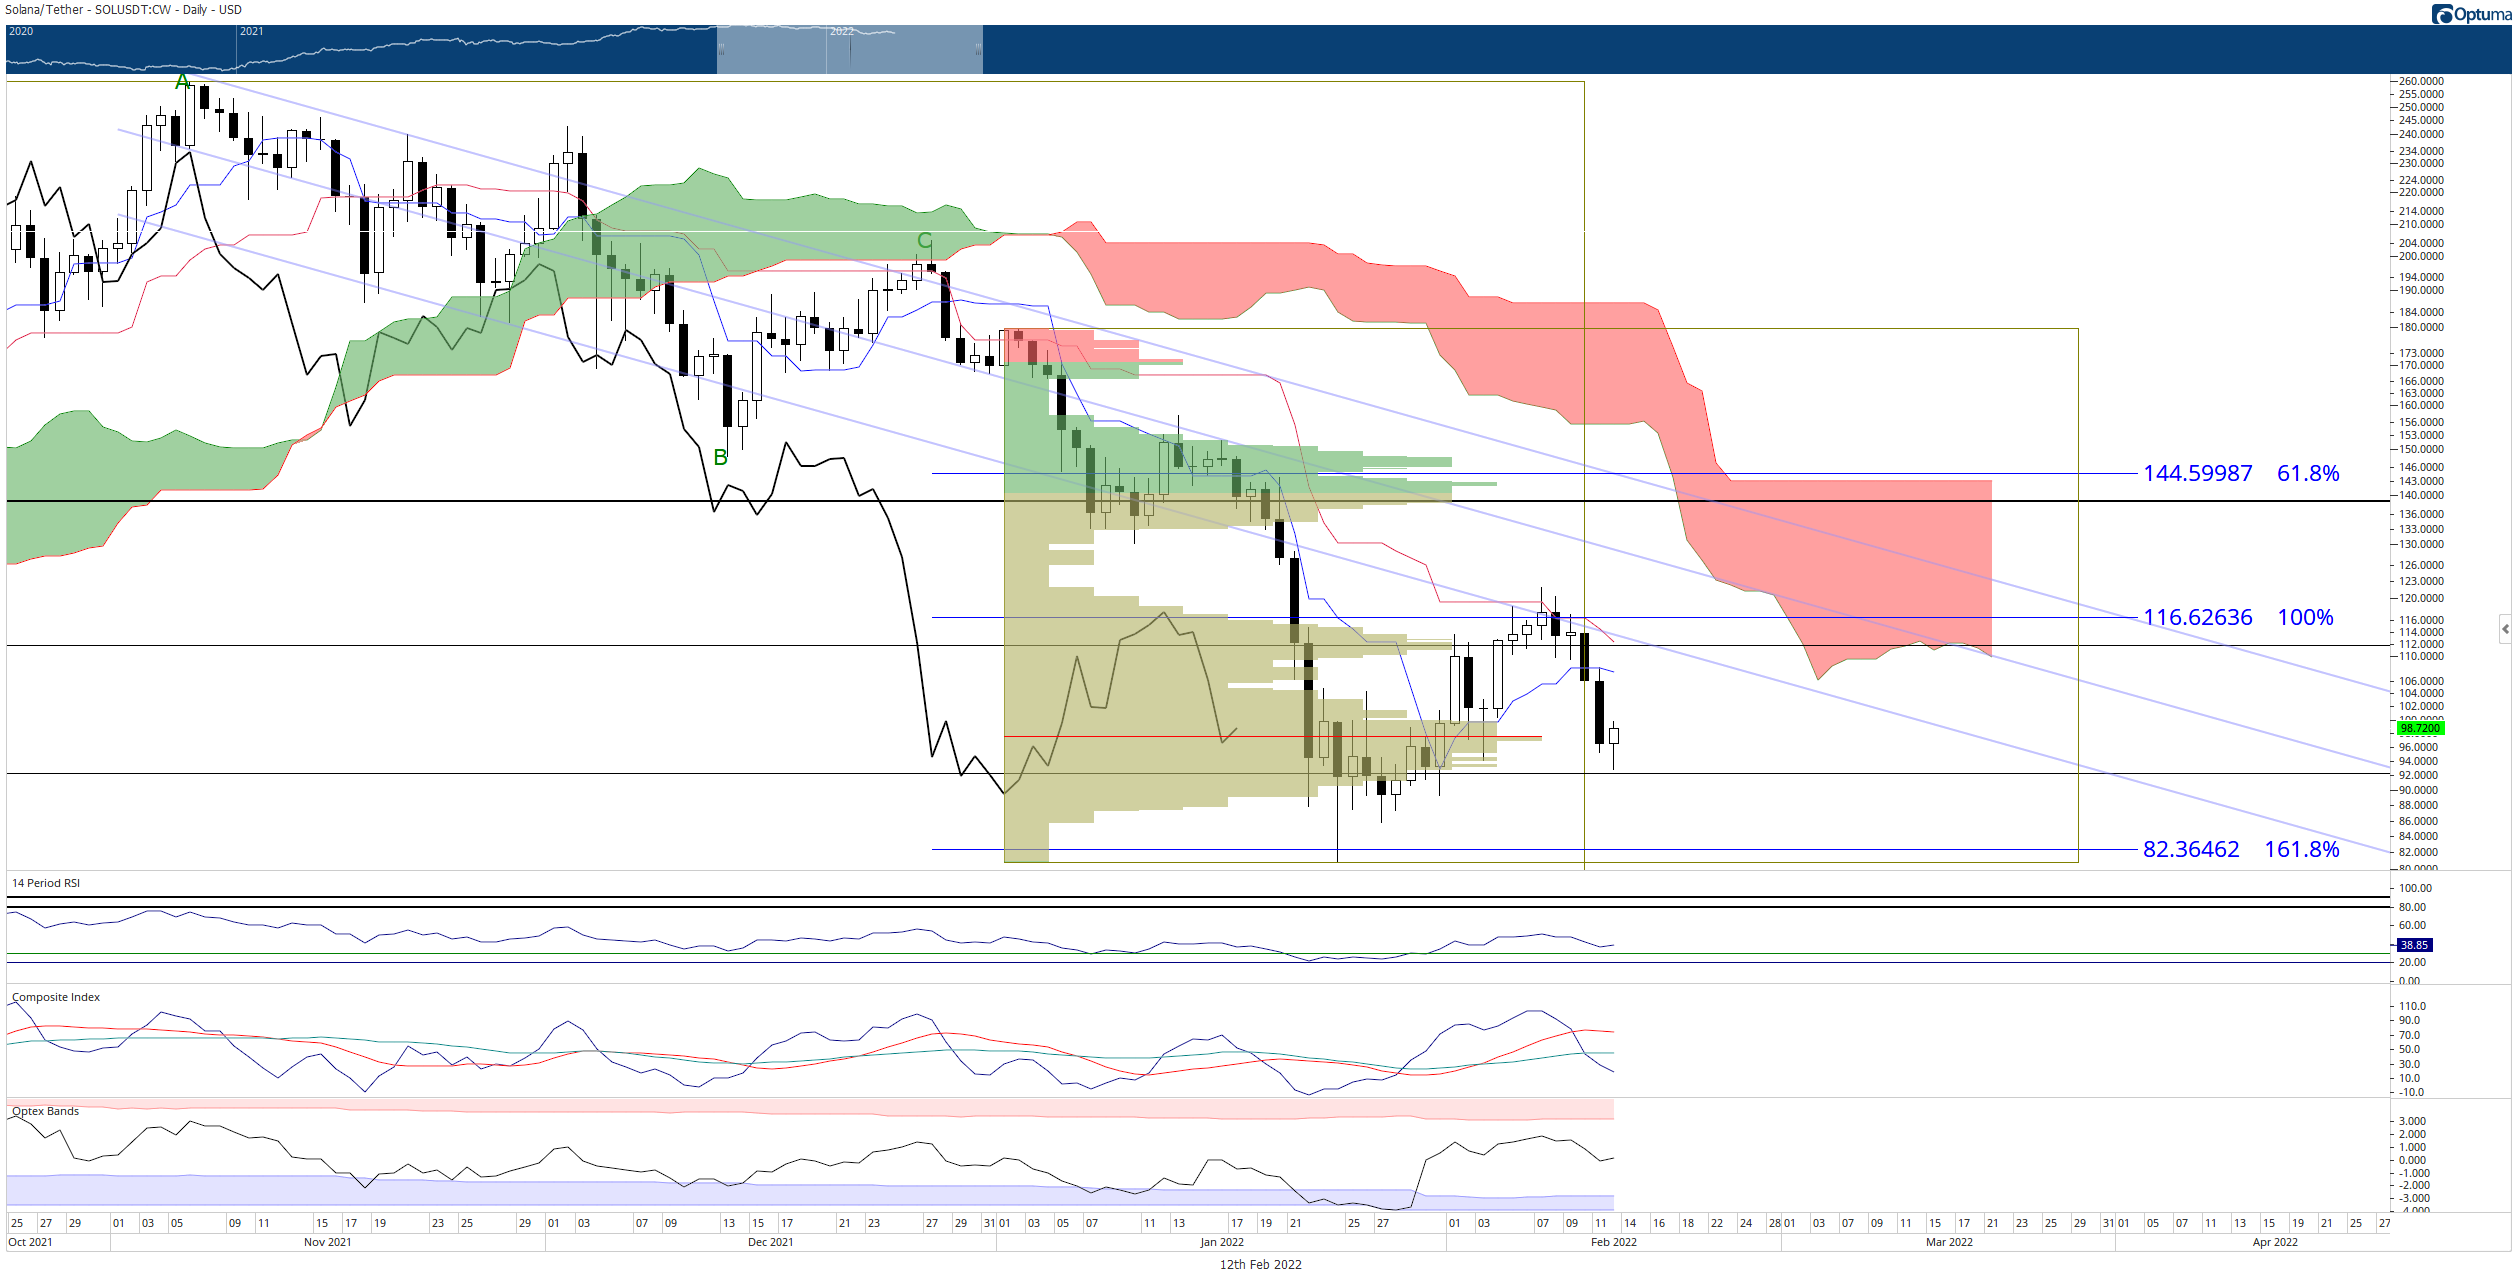
SOL/USDT Daily Ichimoku Kinko Hyo Chart
If Solana price can rally to form a daily candlestick close at or above the $115 price level, then a renewed uptrend is likely to occur with a target near the next primary resistance cluster at $144. However, if bulls fail to close Solana price at least above the Tenkan-Sen, then a bearish continuation move towards the 2022 lows at $82 is highly probable.
Author

Jonathan Morgan
Independent Analyst
Jonathan has been working as an Independent future, forex, and cryptocurrency trader and analyst for 8 years. He also has been writing for the past 5 years.


