Solana price hits make-or-break point following 50% gains
- Solana price moves against the most critical resistance level on its chart.
- If bulls can close SOL above this resistance zone, a 25% rally could occur.
- Sellers could push Solana lower by nearly 30% if resistance holds.

Solana price action has seen persistent bullish pressure over the past three trading days. As a result, buyers continue to push SOL higher inch by inch, precisely on top of the single greatest resistance cluster on its daily Ichimoku chart.
Solana price at the precipice of a significant rally or a major sell-off
Solana price action is currently testing its final primary resistance zone at the $120 value area. There are three technical resistance levels that SOL bulls must move and close above to initiate a new uptrend:
- The 100% Fibonacci expansion at $116.
- The bottom trendline of the bull flag (blue linear regression channel) at $116.
- The daily Kijun-Sen at $120.
If bulls can push Solana price to a close above all three of those levels, then the path to the next major resistance level at $144 becomes much more manageable as resistance dies off considerably. However, failure to achieve a close at or above $120 could signal disaster.
There are two red arrows on the chart image below, one on the candlestick chart and another on the Composite Index. The red arrow on the candlestick chart is pointing down, displaying a series of lower highs. The red arrow on the Composite Index is pointing up, indicating higher highs. The discrepancy between the candlestick chart and the Composite Index is known as hidden bearish divergence.
Hidden bearish divergence is only valid if an instrument is already in a downtrend (which Solana is). It is a warning sign that the current upswing is likely weakening and that the dominant and overall downtrend will continue. When hidden bearish divergence appears, and price action is against a resistance level or zone, then the likelihood of a continued downtrend substantially increases.
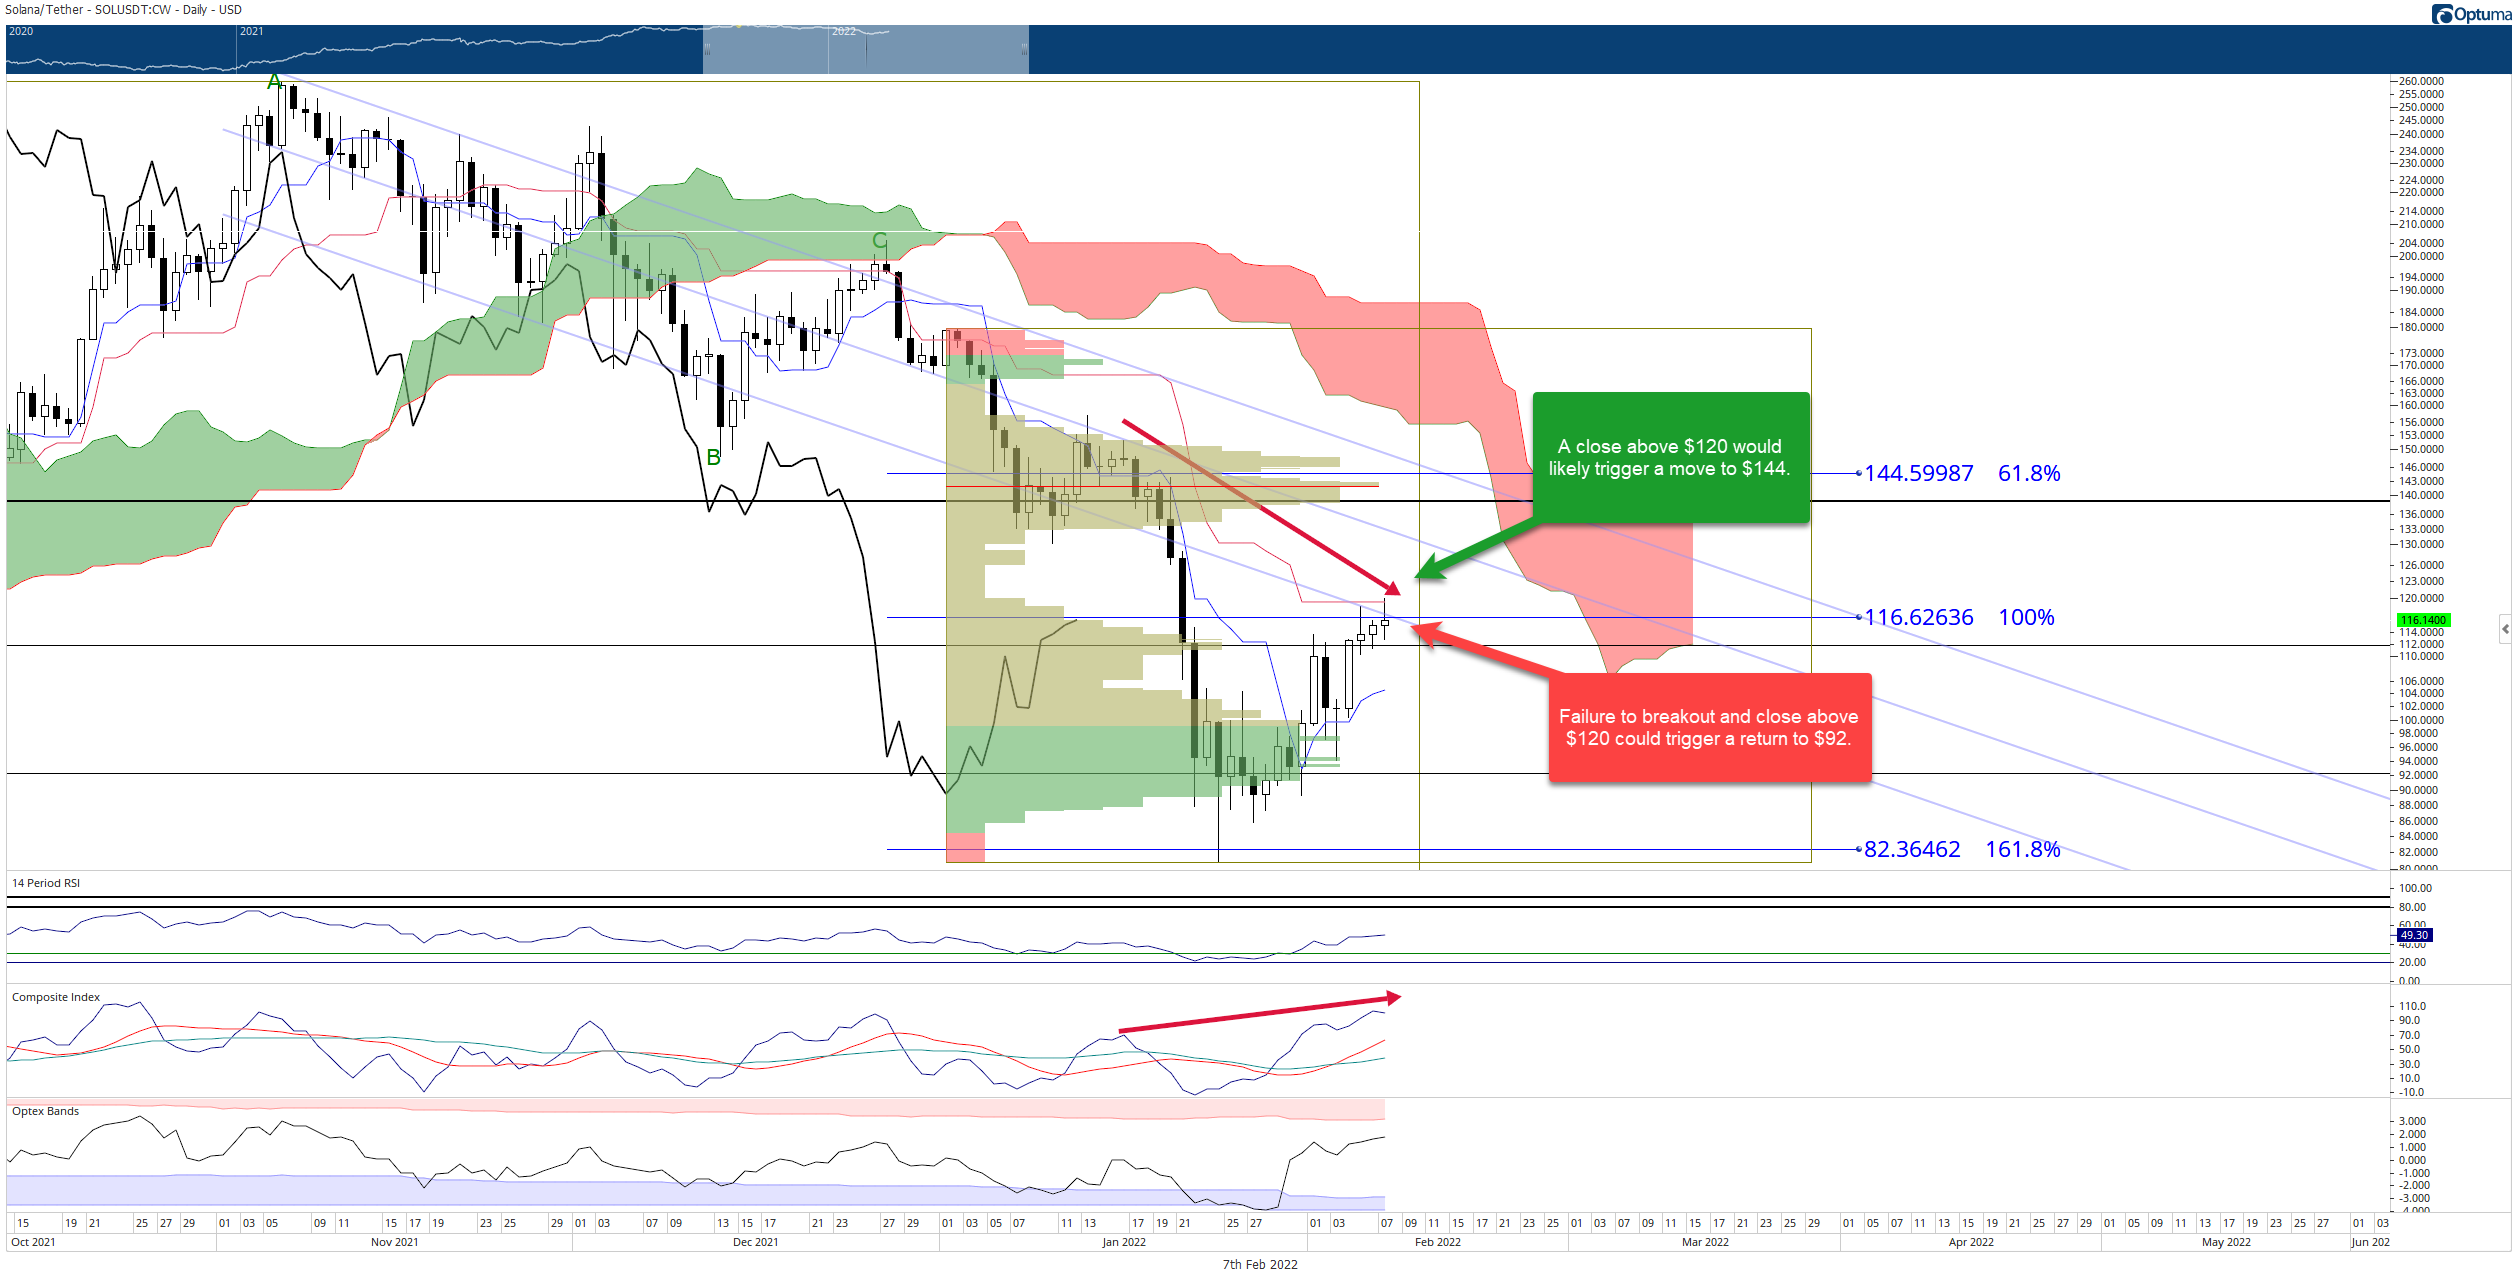
SOL/USDT Daily Ichimoku Kinko Hyo Chart
Failure to breakout above the $120 value area for Solana price would result in, at minimum, a retest of the 61.8% Fibonacci retracement at $92 and possibly even lower to the 161.8% Fibonacci retracement and 2022 low near $82.
Author

Jonathan Morgan
Independent Analyst
Jonathan has been working as an Independent future, forex, and cryptocurrency trader and analyst for 8 years. He also has been writing for the past 5 years.


