Solana price clings to 88% upswing narrative as SOL joins BTC and ETH on Bloomberg Terminal
- Solana price is currently testing the $216 support level in hopes of triggering an 88% rally.
- SOL becomes the third cryptocurrency after Bitcoin and Ethereum to be listed on the Bloomberg Terminal.
- A breakdown of the $200 psychological barrier will invalidate the bullish thesis.

Solana price is currently hovering around a crucial demand zone that needs to hold for an upswing to emerge. Breaching this barrier will reduce the probability and also open SOL up for a potential correction.
Bloomberg welcomes SOL after BTC and ETH
Solana price can now be tracked on the Bloomberg Terminal via the “Bloomberg Galaxy Solana Index,” making it the third cryptocurrency after Bitcoin and Ethereum to have this feature. Tim Grant, the Head of Europe at Galaxy Digital, announced that this development was a result of the collaboration with Galaxy Digital and Bloomberg LP.
Grant stated,
This marks our fifth index in the Bloomberg Galaxy family of indices which are... Bloomberg Galaxy Bitcoin Index (BBG TICKER: BTC), Bloomberg Galaxy Ethereum Index (BBG TICKER: ETH), Bloomberg Galaxy Crypto Index (BBG TICKER: BGCI), Bloomberg Galaxy DeFi Index (BBG Ticker: DEFI), Bloomberg Galaxy Solana Index (BBG Ticker: SOL).
This institutional-grade index for Solana will now be available globally to 400,000 users, and the pricing source will allow Solana-based products to be launched in jurisdictions that allow it.
Solana price contemplates directional bias
Solana price set up two rounded-bottom structures between September 9 and November 2. The larger structure is referred as the cup, while the smaller one that follows it is known as the handle. The peaks of these structures can be connected using a trend line to form a horizontal resistance barrier at $216.
The cup-and-handle pattern forecasts an 88% upswing to $407, determined by adding the distance between the cup’s swing low and the horizontal supply barrier at $216.
While Solana price broke out on November 2 and rallied 20%, the recent downswing has undone the gains.
Currently, SOL is hovering around $216 and inside a demand zone, extending from $208 to $218. Solana price needs to hold above this area to have the highest probability of an upswing.
In some cases, Solana price could extend its climb and retest the 161.8% Fibonacci extension level at $430.
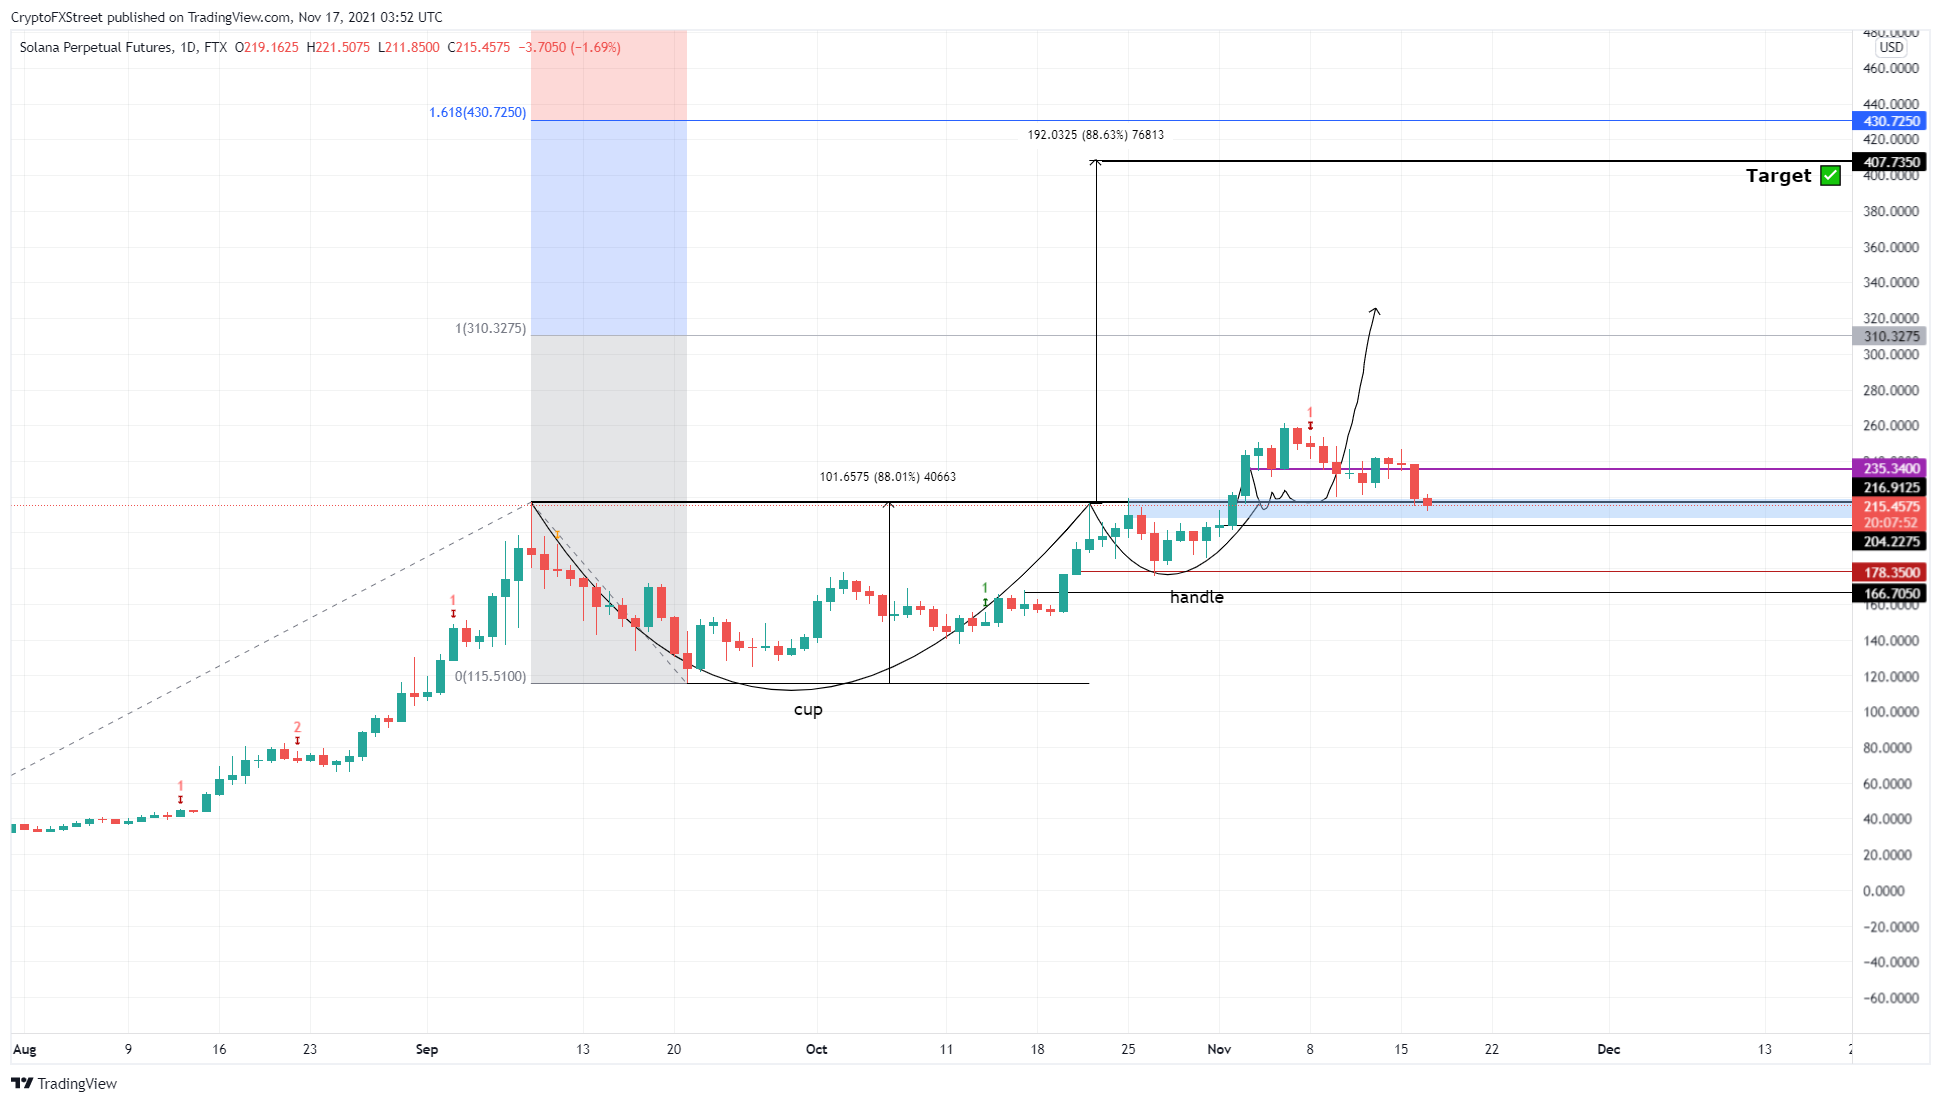
SOL/USDT 1-day chart
However, a failure to do so will result in a retest of the $204 support level. If SOL produces a lower low below the $200 psychological level, it will invalidate the cup-and-handle bullish thesis. In this case, SOL could head to the $178 support level, where the buyers could give the upswing another go.
Author

Akash Girimath
FXStreet
Akash Girimath is a Mechanical Engineer interested in the chaos of the financial markets. Trying to make sense of this convoluted yet fascinating space, he switched his engineering job to become a crypto reporter and analyst.



