Solana price hit a curb and saw bulls cashing after forming an all-time high double top
- Solana price came under pressure after the bulls made new all-time highs for a second week in a row.
- Price action faded quickly to the downside and broke below $221.38.
- With the weekly RSI in oversold territory, SOL price needs a breather before making new highs.

Solana price made new all-time highs by just a few ticks against the previous week's all-time high. Bulls were relatively quick to start book profits and made price action correct quickly by almost 20%. The monthly R1 resistance level does not show any sign of resistance or support to be taken into account, and thus abled bears to run price towards $221.38.
Solana price requires another correction to provide new buyers more upside potential
Solana price was on a perfect bullish candle last week, holding 37% of gains. This week, however, proved to be more challenging for SOL price bulls as Solana price came under pressure by profit-taking at the new all-time highs, and some headwinds popped up as global markets rolled over after higher than expected US inflation prints worrying the markets. With the weekly R1 resistance level not holding any importance, SOL price bears could pair back most of the gains from last week.
SOL price saw a break below $221.38, but that correction did not prove enough to get the weekly Relative Strength Index (RSI) out of the overbought territory. This element will refrain new buyers or current stakeholders from adding more positions to their Solana holdings. Solana price would need to correct further to the downside towards the green ascending trend line near $185 to have the RSI in more neutral territory.
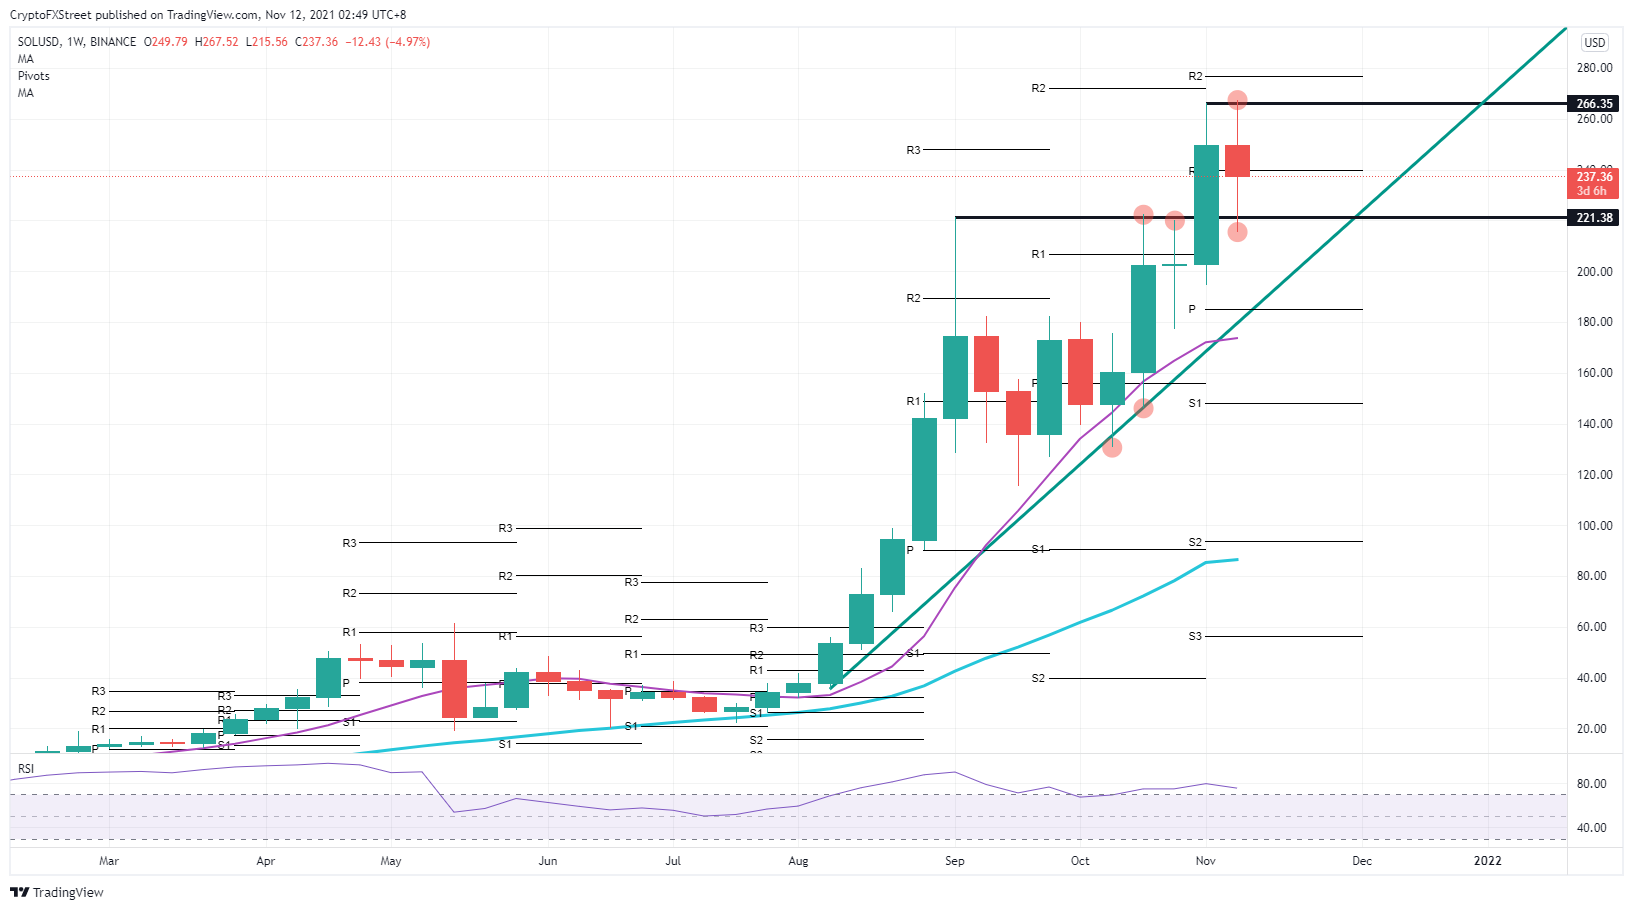
SOL/USD weekly chart
When SOL price would trade around the green ascending trend line, and the monthly pivot at $185.00 comes into the picture, SOL price bulls will have three incentives to get long Solana price again, as the RSI will be in their favor as well. Should bears be able to break below the green ascending trend line, expect the 55-day Simple Moving Average to give additional support near $175.00.
Author

Filip Lagaart
FXStreet
Filip Lagaart is a former sales/trader with over 15 years of financial markets expertise under its belt.


