Solana pauses for support while SOL targets $215
- Solana price gains as much as 35% in a week, creating new two-week highs.
- Solana breaks above both the Tenkan-Sen and Kijun-Sen, signaling strength and a desire for a resumption of its initial bullish expansion phase.
- Final bearish resistance zones in the oscillators remain and must be invalidated to confirm any new bull market.

Solana price has regained the majority of its losses from its all-time high and shows evidence of a continuation move higher. Thus, nearly all conditions necessary to fulfill an Ideal Bullish Ichimoku Breakout are complete, but some hints of near-term weakness remain.
Solana price must close above $188 to resume the move towards new all-time highs
Solana price has a limited amount of time to confirm that the present rise is an honest move. First, the Chikou Span must move and close above the candlesticks to confirm a new bullish expansion phase. That means Solana would need to close at or above $188. That threshold decreases over the next eight consecutive days.
However, the oscillators point to some warning signs that could terminate any near-term bullish price action. The Relative Strength Index is in bear market conditions and Solana has faced resistance against the final overbought condition at 65. Likewise, the Composite Index has hidden bearish divergence with a series of lower highs on the Solana price chart but higher highs on the Composite Index. Finally, the Optex Bands continue to trend higher and are approaching the extreme overbought levels.
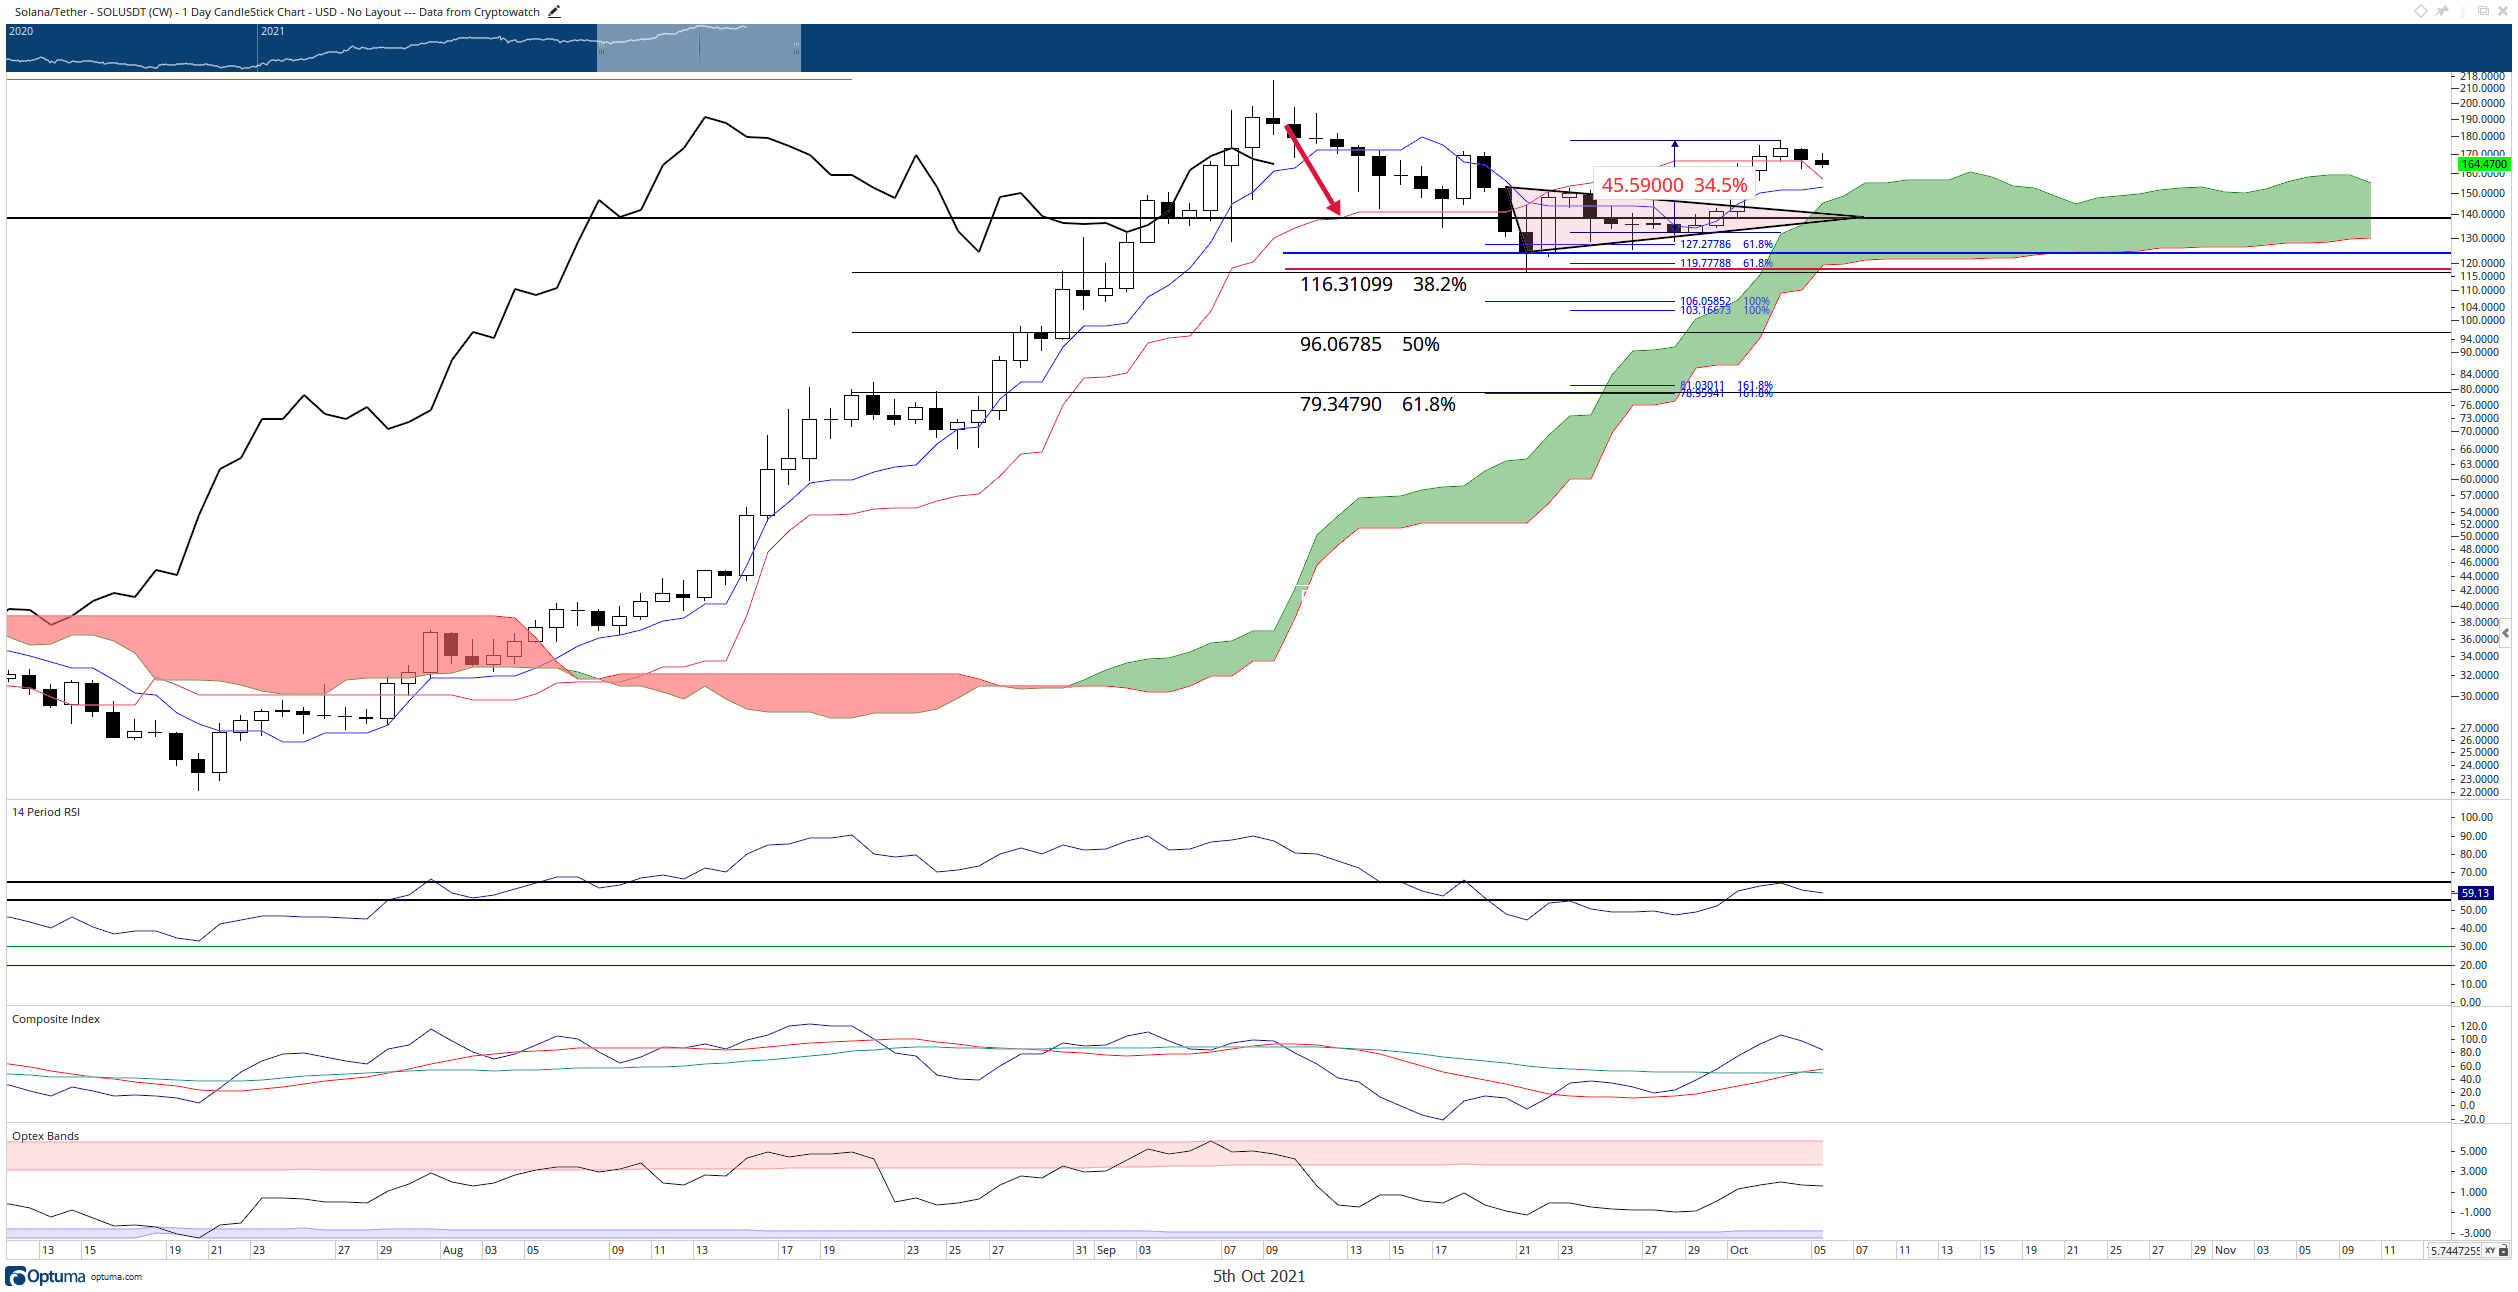
SOL/USDT Daily Ichimoku Chart
For bulls to negate any current bearish divergence, they will need to push Solana price higher and to a price level that will push the Chikou Span above the candlesticks.
Like this article? Help us with some feedback by answering this survey:
Author

Jonathan Morgan
Independent Analyst
Jonathan has been working as an Independent future, forex, and cryptocurrency trader and analyst for 8 years. He also has been writing for the past 5 years.


