Shiba Inu’s recovery is staggering, but one swallow does not make a summer
- Shiba Inu price is set to rebound back to either $0.00001400 or $0.00001708.
- SHIB price is still under plenty of bearish pressures as the downtrend is nowhere near an end.
- The current turmoil in stablecoins is negatively impacting cryptocurrencies, setting the scene for SHIB to drop towards $0.00000655, breaching $0.00001000.

Shiba Inu (SHIB) price is recovering a bit after it incurred massive losses and instead looked like a wounded deer that has its life hanging by a thread. It is not just the dollar strength and the correction in the stock market but also the weak point in cryptocurrencies that have been exposed in total, with Tether and Stablecoins questioning their credibility. An existential crisis is not yet in the making, but once SHIB price dips below $0.00000655, a total liquidation could be at hand.
SHIB price has the world questioning who will step in to catch the first domino falling
Shiba Inu price is falling off its pedestal, and saw a massive outflow of capital these past few trading days. Although the markets look set to close the week by paring back some losses or even possible small gains, that does not mean that all is forgiven. Where investors and traders are always happy to buy the dip, SHIB price is not seeing a volume return.
SHIB price has that massive headwind blowing in its face after more questions are raised on Tether and Stablecoins. Since those are all privatised firms and enterprises, not providing any detail on their balances (as apparently, they are afraid to give away the secret sauce), at any moment now, one Stablecoin could default, triggering a massive domino-effect with no failsafe system as there is not one central bank mandated to intervene and stop the next domino from falling. With that reassessment of risk, SHIB will need to correct further and is set to be rejected around either $0.00001400 or $0.00001708 and see bears using those handles to push the price to the downside near $0.00000655.
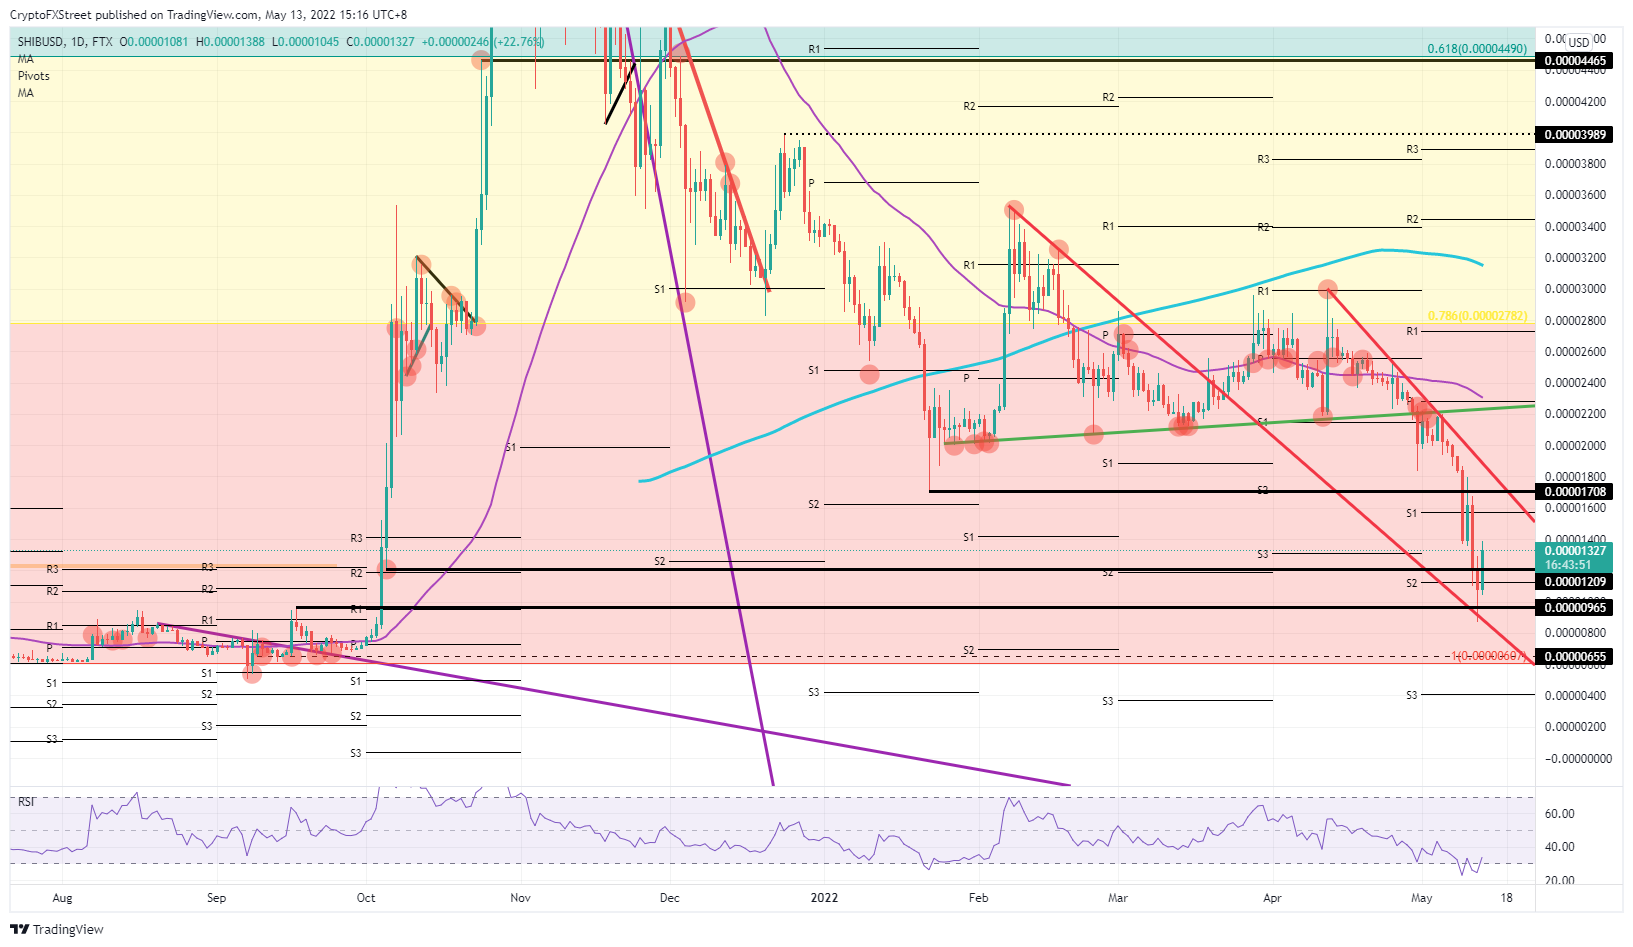
SHIB/USD daily chart
On the upside, only breakthrough headlines can save the day for now, with either headlines that a peace truce has been reached between Russia and Ukraine or that inflation is slowing down across the globe. Once some positive headlines cross the wires, expect SHIB price to pierce through the recent supports turned into resistance and break above $0.00001708. A pickup in buying volume could be seen with renewed trust, resulting in SHIB ticking $0.00002282 with the green ascending trendline, the 55-day Simple Moving Average and the monthly pivot as a triple cap to the upside.
Author

Filip Lagaart
FXStreet
Filip Lagaart is a former sales/trader with over 15 years of financial markets expertise under its belt.



