|

Investors are on edge as Shiba Inu price may have gone too far

  • SHIB price has breached a key Fibonacci level.
  • Shiba Inu price has lost support from buyers on the Relative Strength Index.
  • Invalidation of the bearish outlook is break and close above $0.00001774.

Shiba Inu price displays concerning signals which could shake out the strongest SHIB investors.

Also read: Is MSTR stock facing possible bankruptcy on Bitcoin collapse?

Shiba Inu price due for more decline 

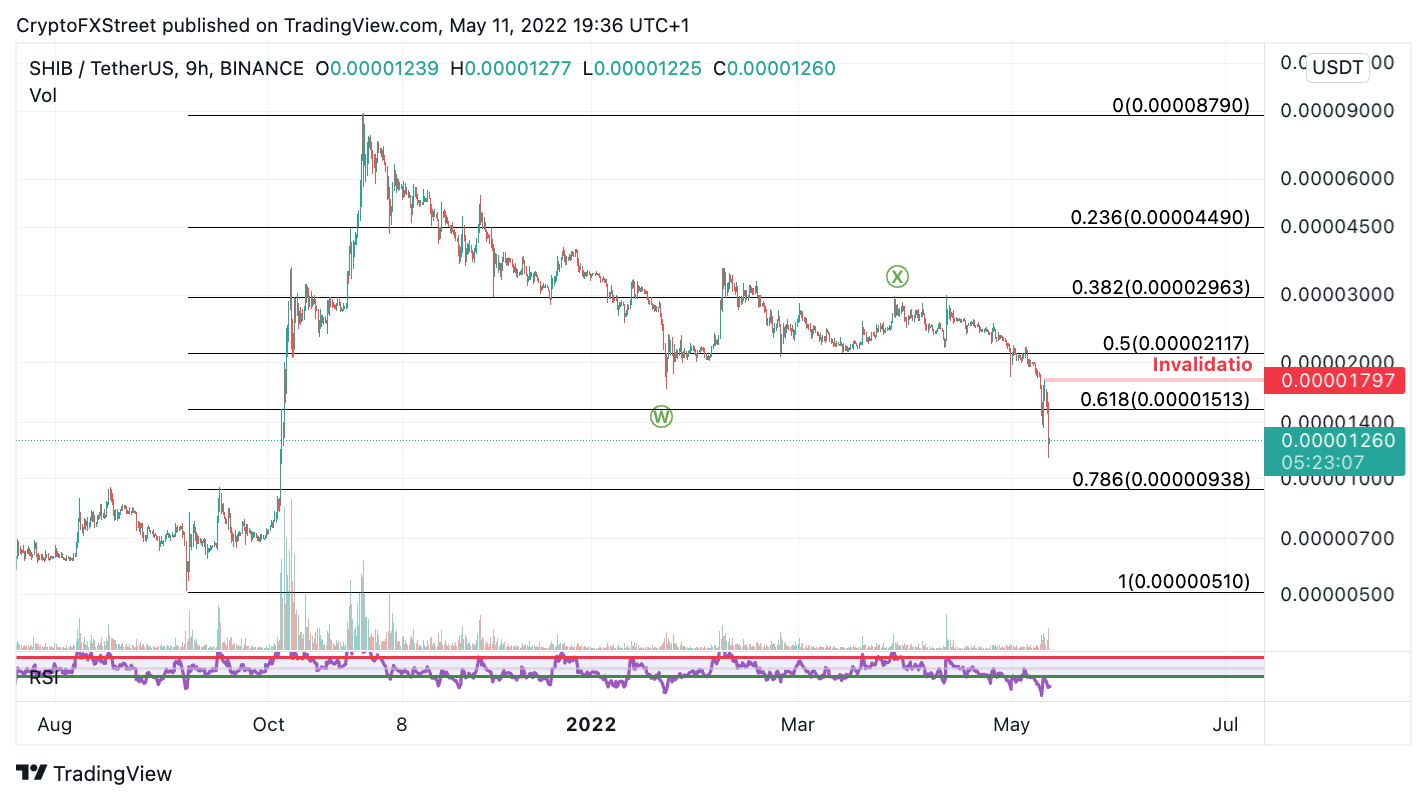
Shiba Inu price shows evidence that more price drops are likely for the notorious meme coin. The self-proclaimed “Doge Killer” looks like roadkill as the bears have managed to breach previously held support zones at $0.00001839. The 61.8% Fibonacci retracement level surrounding the all-time-low and all-time-high at $0.00001513 was recently breached with a bearish engulfing candle.

Shiba Inu price is also losing support from investors who thought the current dip was worth buying. The Relative Strength Index confounds this idea as the buyers’ support levels have been breached in multiple time frames. The bears are likely in profit and will not be closing their shorts until lower liquidity levels, such as the $0.000000666 zone, are tapped. 
TM/SHIB/5.11.22

SHIB/USDT 9-Hour Chart

Still, weekly and monthly charts will be the ultimate deciding factor for the Shiba recovery rally. If the SHIB price can breach the $0.00001774 a bullish hammer could print on the weekly chart. Thus there could be potential for a relief rally to $0.00003000, resulting in a 130% increase from the current Shiba Inu price.

Author

Tony M.

Tony M.

FXStreet Contributor

Tony Montpeirous began investing in cryptocurrencies in 2017. His trading style incorporates Elliot Wave, Auction Market Theory, Fibonacci and price action as the cornerstone of his technical analysis.


More from Tony M.
Share:

Editor's Picks

Top 3 Price Prediction: BTC gains strength as ETH and XRP selling eases

Top three cryptocurrencies, Bitcoin, Ethereum, and Ripple, are holding steady on Wednesday after a bullish close the previous day. The mild recovery hints at an extended rally as the prevailing bearish pressure eases. Bitcoin trades at $82,930 on Wednesday, holding a bullish near-term bias following a mild rebound the previous day.

Ethereum staking hits record, but yield and fee revenue fall

Ethereum staking reached a record 43.8 million ETH in Q3 2026 amid a decline in annualized staking yields, according to crypto asset manager Bitwise. In its Q4 staking report on Tuesday, Bitwise stated that staked Ether accounted for 35.9% of the asset’s total supply by the end of the quarter. Net staking inflows reached 1.99 million ETH, marking the sixth straight quarter of growth.

 Bitcoin resumes Nasdaq correlation as macro pressures threaten $82,500 support

Bitcoin's correlation with the Nasdaq is rising again after last week's decline alongside tech stocks, even as macro pressures place the $82,500 support at risk. In a report on Tuesday, K33 Research highlighted that Bitcoin has resumed its correlation with the tech-heavy Nasdaq after last week's price movements.

 Bitcoin resumes Nasdaq correlation as macro pressures threaten $82,500 support
Bitcoin's (BTC) correlation with the Nasdaq is rising again after last week's decline alongside tech stocks, even as macro pressures place the $82,500 support at risk. In a report on Tuesday, K33 Research highlighted that Bitcoin has resumed its correlation with the tech-heavy Nasdaq after last week's price movements.
Bitcoin: Macroeconomic headwinds, cooling demand cap BTC gains
Bitcoin (BTC) extends losses this week, trading below $82,500 as of Friday as selling pressure continues. Weakening institutional demand supports this pullback as BTC spot Exchange-Traded Funds (ETFs) are on track to record a two-week withdrawal streak, reaching $146.19 million in net outflows through Thursday.