Shiba Inu rejected at key resistance as SHIB’s Christmas rally stalls
- Shiba Inu price action fails to break above $0.00003989.
- SHIB price takes a step back during the ASIA PAC session and flirts with the low of the week.
- A further dip lower could spark a return to $0.00003000.
Shiba Inu (SHIB) price hit a curb during the Christmas rally when bulls failed to make a new high. Even more worrying was the Relative Strength Index (RSI) which took a dip, pointing to investors cashing in on their profits. The behaviour of the indicator suggests further upside momentum may be limited. With global markets on the back foot as well, expect there to be a slight shift in sentiment that could further weigh on price action this week.
SHIB price set to tank 20%
Shiba Inu price had a solid rally last week, hitting $0.00003989, and making a three-week-high on Christmas Eve. But that is where the good news stops as bulls refrained from making new highs in the days that followed, which made investors worry about the further potential of the trend and pull out their money. This was reflected in the RSI, which made a knee jerk reaction to the downside.
SHIB price action has to deal with some headwinds emerging in global markets due to rising Omicron cases across the globe. With investors negative going into 2022 safe havens are likely to see more inflows, whilst risky assets are left to bleed. This would reverse the gains SHIB price made last week and push bulls against the monthly S1 support level near $0.00003000. With the 78.6% Fibonacci level just below there at $0.00002782, it is likely to provide enough of a defence to prevent December price action from making new lows.
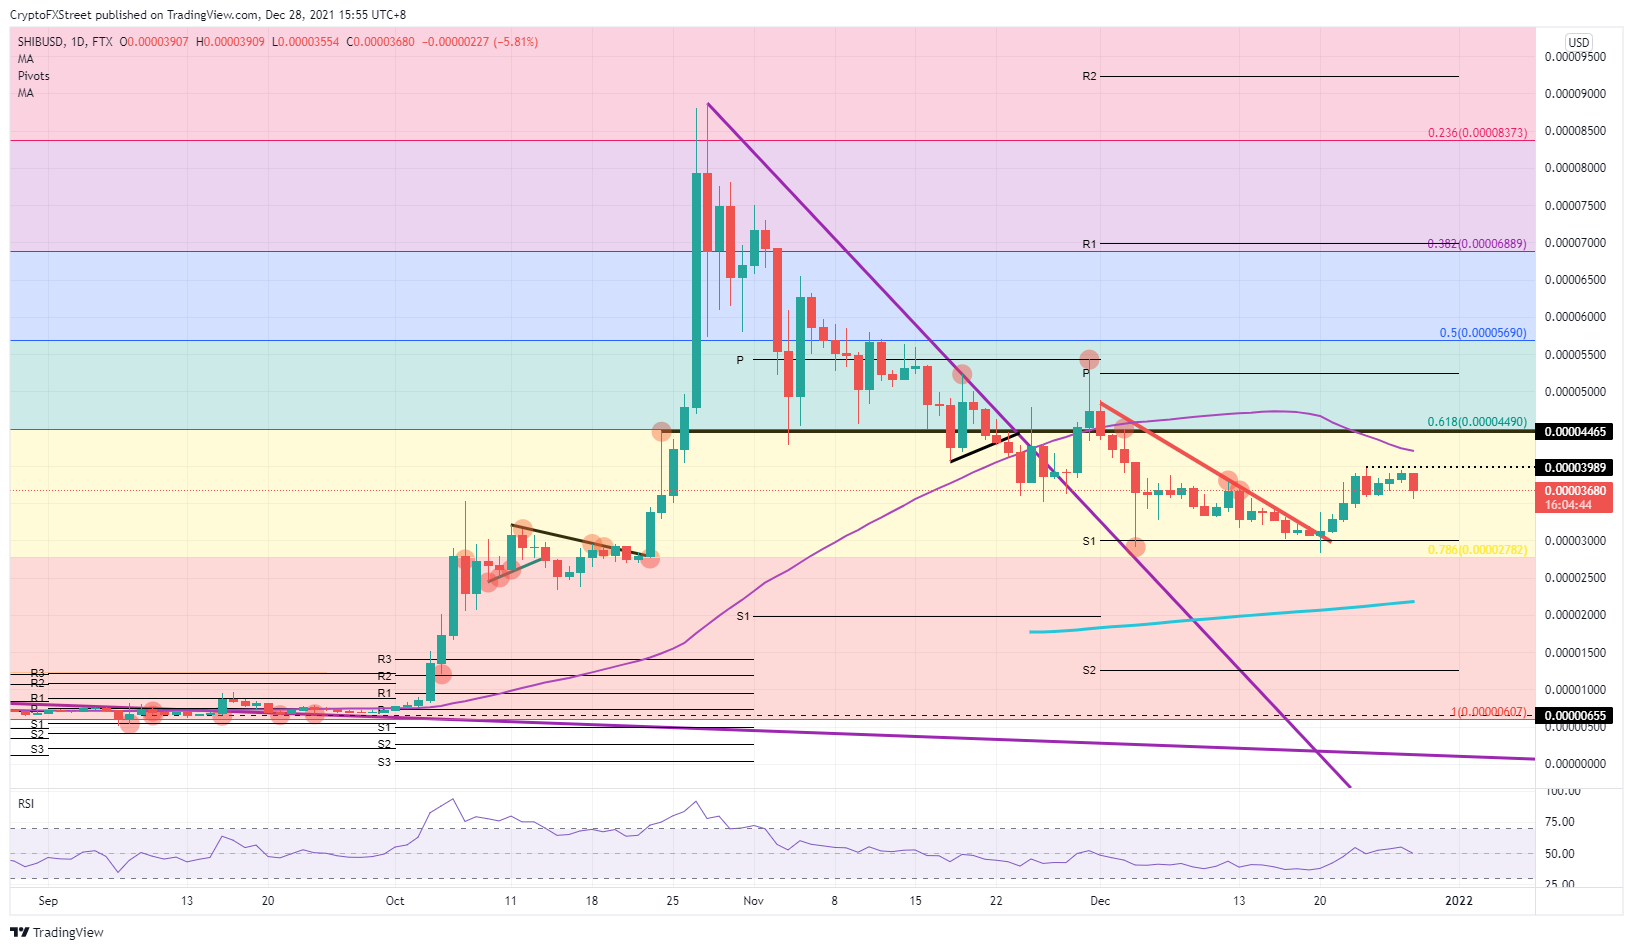
SHIB/USD daily chart
Expect a bounce to unfold from the monthly S1 support level that will trickle into a new rally towards $0.00004490 and break above the 55-day Simple Moving Average (SMA) along the way. By then the RSI is likely to be barely in overbought territory, triggering some new profit-taking with a soft fade in search of the 55-day SMA. In a second leg higher, the 50% Fibonacci level at $0.00004490 looks more important than the monthly pivot at $0.00005247, which looks more like a footnote rather than a critical level to keep in mind.
Author

Filip Lagaart
FXStreet
Filip Lagaart is a former sales/trader with over 15 years of financial markets expertise under its belt.


