Shiba Inu Price Prediction: SHIB investors need their eyes on the prize as 30% rally awaits
- Shiba Inu price consolidates after triggering an inverse head-and-shoulders pattern on June 28.
- SHIB being pressured by the declining 50-day simple moving average (SMA), which risks the short-term outlook.
- Twelve-hour Relative Strength Index (RSI) not overbought, opening up the potential for a quick resumption of the pattern breakout.
Shiba Inu price activated the inverse head-and-shoulders pattern on June 28. Nonetheless, the breakout was short-lived, and SHIB has fallen into a consolidation, releasing the overbought conditions on the lower timeframes. If the rookie cryptocurrency can sustain a rally above the declining 50-day SMA, it could rally 33% before striking meaningful resistance.
Shiba Inu price action remains constructive, adding credibility to the pattern
It was a long wait for SHIB investors until Shiba Inu price structure achieved some clarity. Several brief turning points marked the May-June period. Still, the price compression of the rapid correction in early May and the persistent cryptocurrency market volatility prevented the digital asset from constructing a higher probability pattern and timely entry price. However, the inverse head-and-shoulders pattern finally provided the opportunity to engage SHIB from the long side with the June 29 breakout.
The 70% advance from the June 22 low to the June 29 high pushed the lower timeframe Relative Strength Indexes (RSI) into overbought territory, leading to the ongoing consolidation. The consolidation could be defined as a handle formation on top of the inverse head-and-shoulders pattern. So far, the price-volume profile is constructive, suggesting that Shiba Inu price will bust above the 50-day SMA at $0.00000894 and continue the breakout.
The measured move target of the inverse head-and-shoulders pattern is 80%, projecting a Shiba Inu price of $0.00001680, which is just below the 38.2% Fibonacci retracement level of May’s remarkable collapse.
A projection of an 80% gain is generous when considered against the backdrop of an inconsistent cryptocurrency complex and a notable lack of FOMO in meme tokens. A more reasonable Shiba Inu price target is the May 20 and May 24 highs of $0.00001204 and $0.00001214, respectively. A touch of $0.00001214 would yield a 33% gain for SHIB investors from the current position of the neckline.
The historical precedents of XRP and ZIL demonstrate the power of inverse head-and-shoulders patterns. Thus, SHIB investors should not interpret the consolidation as a failed breakout but a new opportunity for portfolio-changing profits.
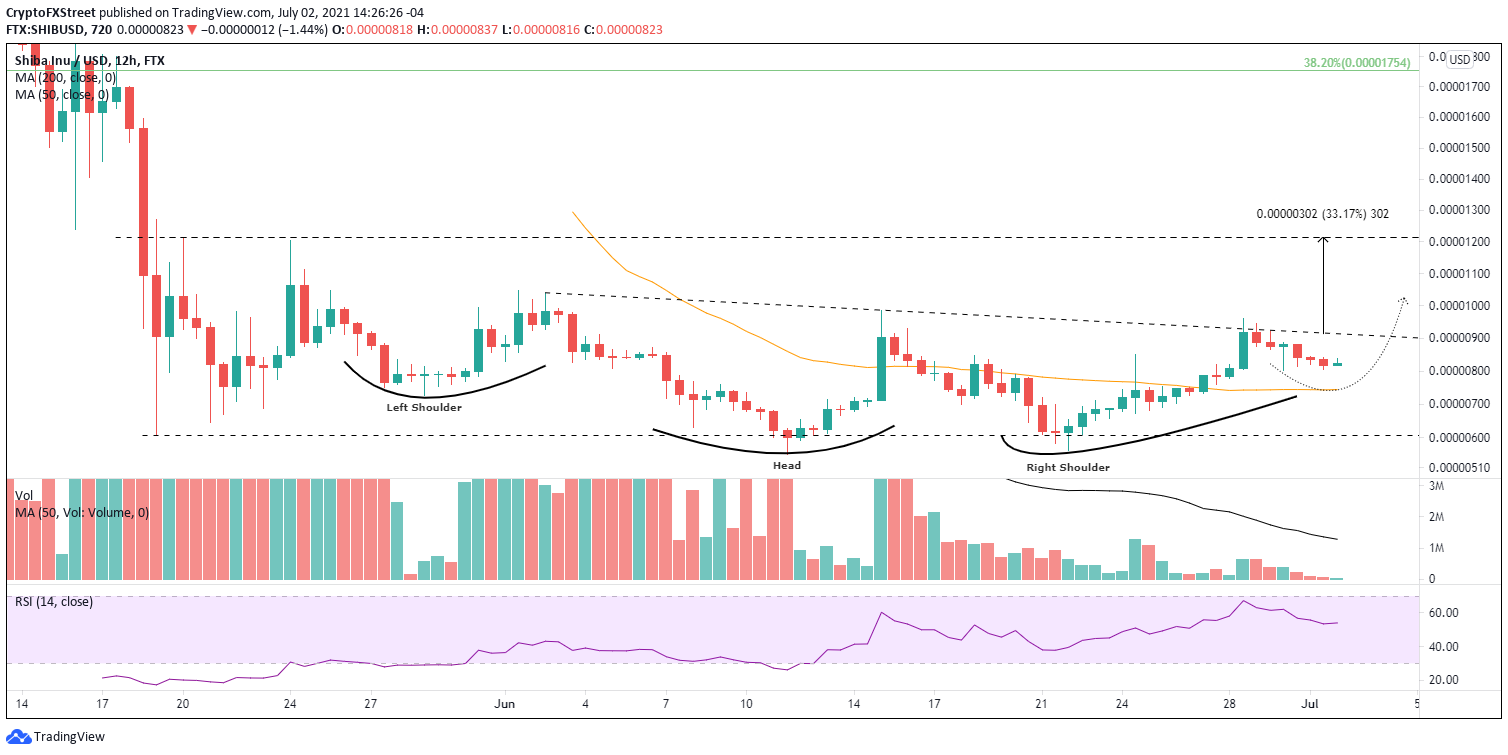
SHIB/USD 12-hour chart
The Shiba Inu price action is constructive, but if the current consolidation or pause evolves into a deeper pullback, SHIB must hold the 50 twelve-hour SMA at $0.00000744 or its at risk of testing the May 19 low or possibly a sweep of the right shoulder low of $0.00000560 and the correction low of $0.00000550.
Shiba Inu price structure finally projects a bullish outcome. Still, the presence of the 50-day SMA as resistance coupled with the indecisiveness across the crypto space should keep SHIB investors alert, but with their eyes on the prize.
Here, FXStreet's analysts evaluate where SHIB could be heading next based on brief technical and on-chain analysis on Shiba Inu price.
Author

Sheldon McIntyre, CMT
Independent Analyst
Sheldon has 24 years of investment experience holding various positions in companies based in the United States and Chile. His core competencies include BRIC and G-10 equity markets, swing and position trading and technical analysis.


