Shiba Inu Price Analysis: SHIB requires patience, but offers a compelling opportunity
- Shiba Inu price triggers inverse head-and-shoulders pattern on June 28, setting the stage for further gains.
- 50 twelve-hour simple moving average (SMA) has turned higher again, offering relevant support as the altcoin makes the turn.
- SHIB is at striking resistance of the now visible 50-day SMA at $0.00000939.
Shiba Inu price has been engaged in a lengthy bottoming process that appears to be finally resolving to the upside after SHIB triggered the neckline of an inverse head-and-shoulders pattern on June 29. If the digital asset can overcome the declining 50-day SMA, it may rally 30% before identifying relevant resistance and interested sellers.
Shiba Inu price enters July with a bounce in its step
SHIB investors have been patiently waiting for some clarity in the price structure since the rapid decline in May. Shiba Inu price hinted at a few turning points, but the weight of the cryptocurrency market volatility kept the meme token from defining a precise turning point. However, this changed on June 29 as SHIB triggered an inverse head-and-shoulders pattern’s neckline before falling back into the base.
The 70% advance from the June 22 low did push the twelve-hour Relative Strength Index (RSI) near an overbought condition, so investors should not label the pullback into the base as a failure but a necessary pause in the evolution of the pattern. Nevertheless, it is essential to note that the 50-day SMA at $0.00000939 lingers just above the neckline, suggesting the pause may endure a few days.
The measured move target of the inverse head-and-shoulders pattern is 80%, projecting a Shiba Inu price of $0.00001680, which is just below the 38.2% Fibonacci retracement level of May’s crash at $0.00001754.
It is a bold forecast, but a more realistic target is the May 24 high of $0.00001204 or the May 20 high of $0.00001214, yielding a 30% gain for SHIB investors.
Interestingly, other cryptocurrencies like XRP and ZIL formed inverse head-and-shoulder patterns before delivering significant returns, albeit from a larger footprint on the charts.
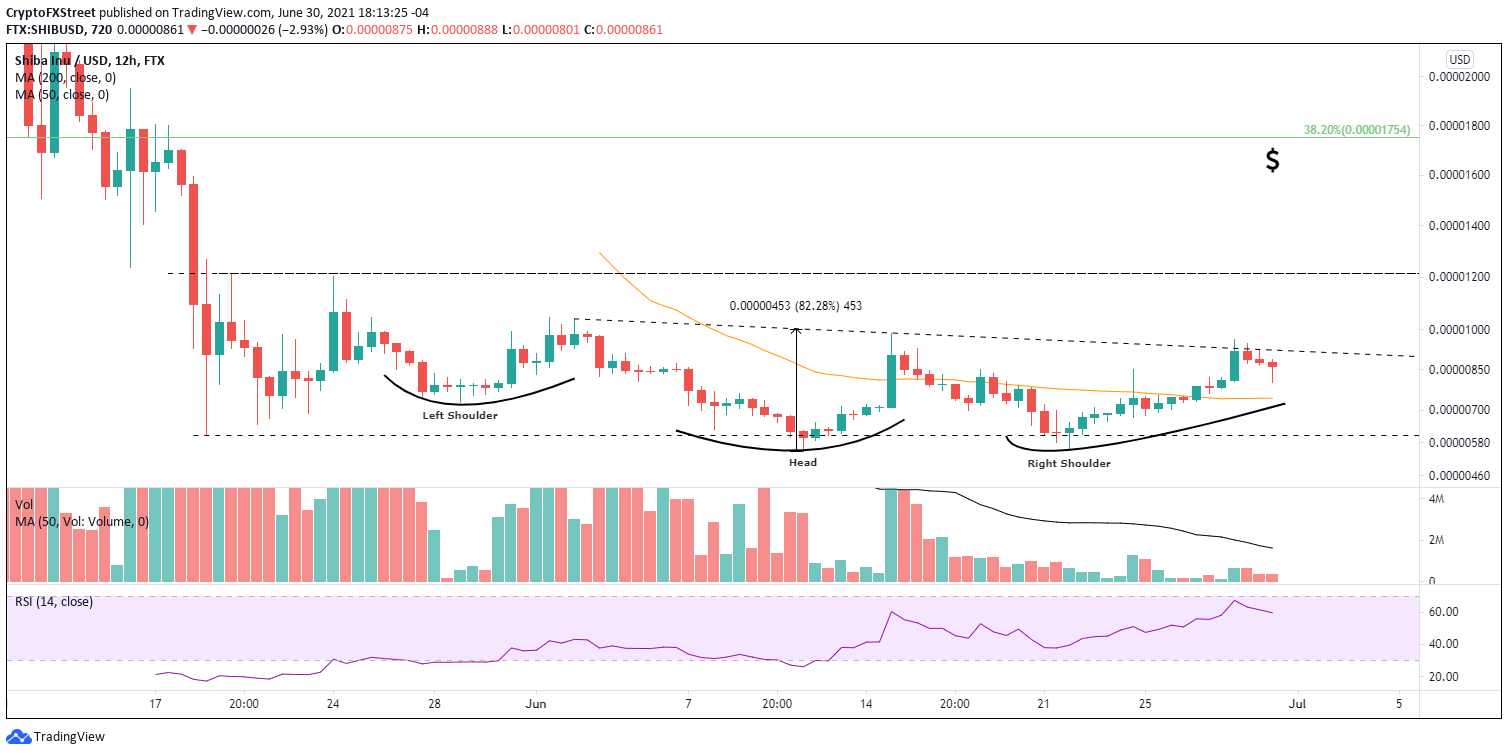
SHIB/USD 12-hour chart
For now, Shiba Inu price action is constructive, but if the pause evolves into a deeper pullback, SHIB needs to hold the 50 twelve-hour SMA at $0.00000744 or risk revisiting the May 19 low or even a sweep of the right shoulder low of $0.00000560. Of course, this scenario gains precedence if the cryptocurrency complex reverts to heavy selling.
The SHIB 30-day MVRV ratio, currently at 13.75%, is indicating a mildly overvalued condition. More specifically, it reveals that the average gain of all addresses that have acquired SHIB in the past 30 days is 13.75%. It is a period that covers the majority of the bottoming process since the May crash.
Generally, the higher the MVRV ratio, the greater the unclaimed profits, thus the higher the risk that SHIB holders will begin to sell and lower their exposure. This is why it is believed that extremely high MVRV ratios indicate overvalued conditions and a reason to sell. In contrast, very low MVRV ratios indicate undervalued conditions and may offer a timely opportunity to accumulate.
The SHIB 30-day MVRV ratio is now positive, but it does not confirm a large reservoir of selling pressure that could enter the market at current prices. However, investors may aim to capture profits around the $0.00001204-$0.00001214 range after the lengthy bottoming process. The 30-day MVRV ratio would still be well below the April and May highs, but that price range would represent a gain of over 100% from the right shoulder low of $0.00000560, representing a notable overvalued condition and a reason to sell.
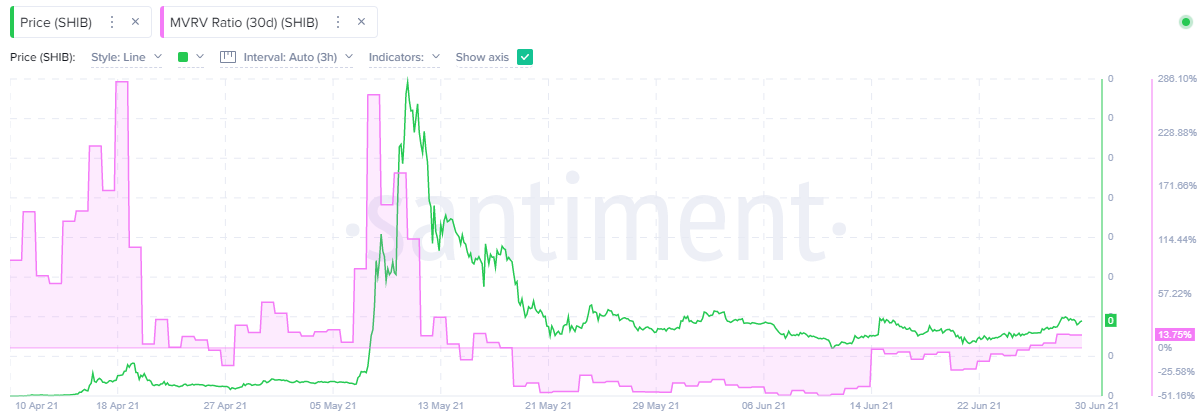
SHIB 30-day MVRV ratio - Santiment
Shiba Inu price is at an inflection point on a micro-scale as it navigates the neckline and the approaching 50-day SMA, but SHIB is far from an overvalued level that would spur heavy selling. For now, it is a technical story until buying pressure can unhook the resistance and release Shiba Inu price to better outcomes.
Author

Sheldon McIntyre, CMT
Independent Analyst
Sheldon has 24 years of investment experience holding various positions in companies based in the United States and Chile. His core competencies include BRIC and G-10 equity markets, swing and position trading and technical analysis.


