Shiba Inu price in consolidation as bulls try to keep control
- Shiba Inu price is seeing further respect of the pennant formation on a weekly chart.
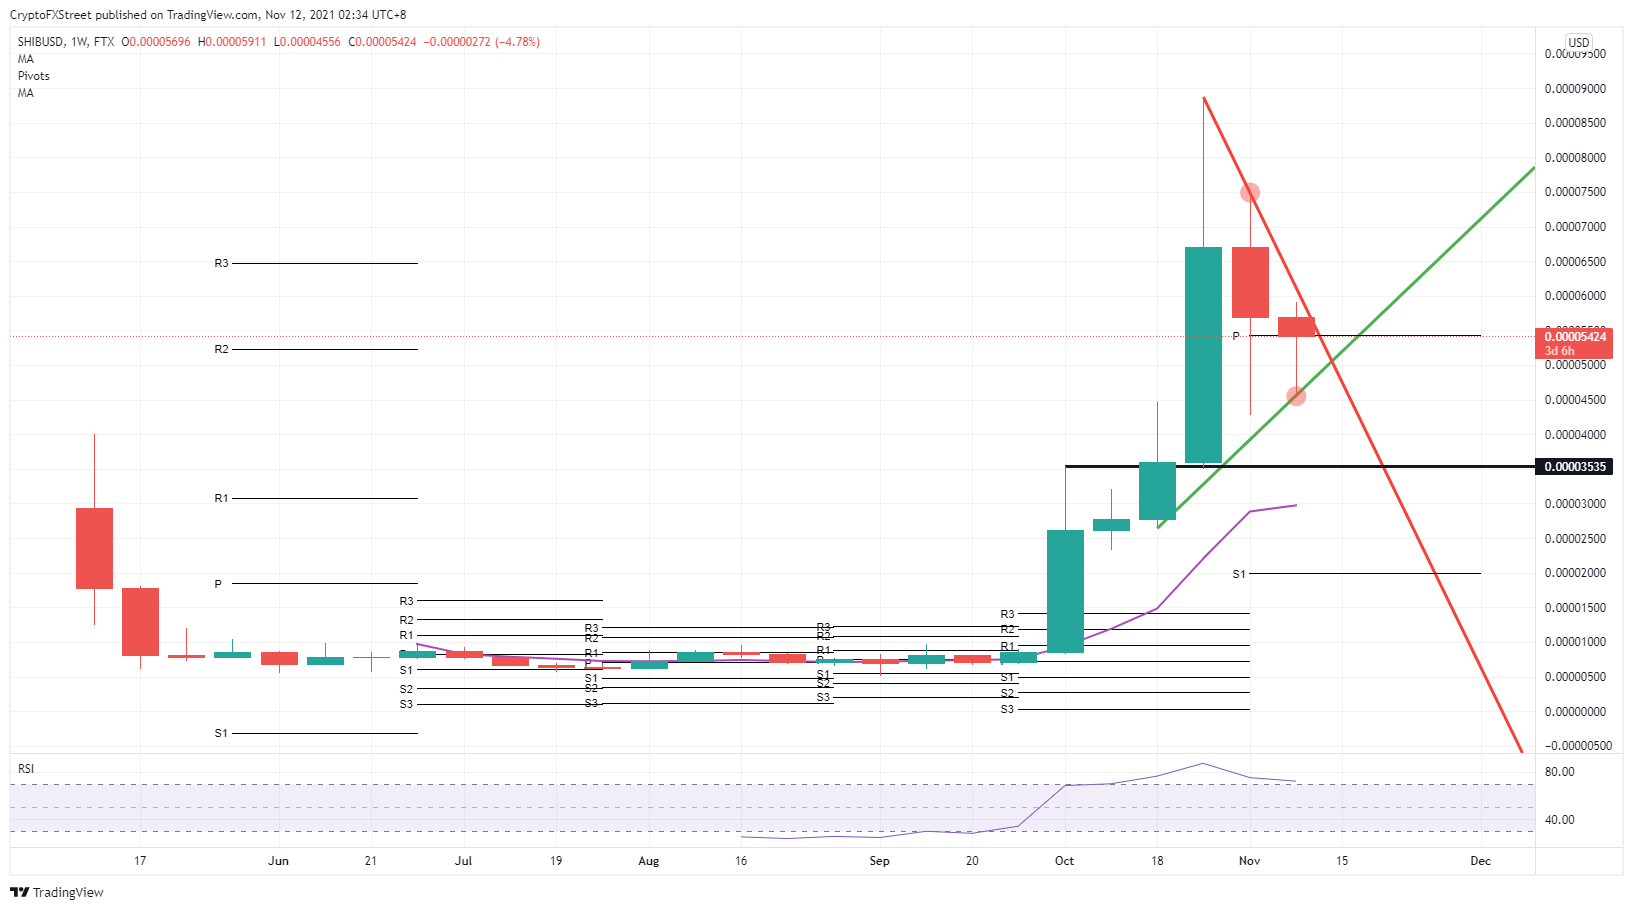
- SHIB price saw bulls trying to keep price action above the weekly pivot at $0.00005433 but failed.
- With the consolidation continuing, the weekly RSI is pointing to overbought.
Shiba Inu price is seeing lower highs and higher lows as SHIB price is getting squeezed from both sides. The pennant looked ready for a bullish breakout, but the US inflation print rattled global markets and pressured cryptocurrencies. As tailwinds start to fade and the weekly Relative Strength Index (RSI) trades in overbought, expect SHIB price to correct further and move towards $0.00004500.
Shiba Inu price sees bulls losing grip as momentum moves against
Shiba Inu price saw bulls trying to push price-action back above the weekly pivot level at $0.00005433 but got stopped in their tracks as tailwinds started to fade after the US inflation print on Wednesday. SHIB price started to trade further to the downside as price action to the upside got capped by the red descending trend line. With the green ascending trend line coming in from below, SHIB price is getting caught in a squeeze with $0.00005000 as mid-price.
SHIB price is expected to fall further to the downside if the weekly pivot cannot keep the price elevated above $0.00005433. Expect, in that case, the green ascending trend line to be tested around $0.00004500. A break below in case market sentiment would turn over would help bears another leg lower towards $0.00003535, an essential historical level with the high from the first week and the low in the last week of October.
SHIB/USD weekly chart
If bulls can shrug off the weekly RSI in oversold territory, and market sentiment shifts back to being a tailwind instead of a headwind, expect a bullish breakout of the pennant within first instance a test on $0.00007500, which falls in line with last weeks high. If bulls can find further momentum and buy-side volume picks up even further after the break above the red descending trend line, expect a possible retest of the all-time high at $0.00008860.
Author

Filip Lagaart
FXStreet
Filip Lagaart is a former sales/trader with over 15 years of financial markets expertise under its belt.


