Shiba Inu Price Forecast: SHIB eyes rebound as bullish divergence emerges and Bitget launches SHIB payment card
- Shiba Inu price steadies on Thursday, with momentum indicators signaling a bullish divergence.
- Shiba Inu partnered with Bitget to launch an exclusive SHIB-branded payment card that enables seamless crypto spending.
- Metrics suggest an undervalued 30-day MVRV ratio, large whale orders, and positive funding rates, reinforcing a strengthening bullish outlook.

Shiba Inu (SHIB) price steadies around $0.0000086 at the time of writing on Thursday, with momentum indicators showing a clear bullish divergence, suggesting an early recovery setup. The recovery case is further supported by Shiba Inu’s recent partnership with Bitget to launch an exclusive SHIB-branded payment card. Adding to this, an undervalued 30-day Market Value to Realized Value (MVRV) ratio, rising large whale orders, and positive funding rates continue to strengthen the recovery thesis for SHIB.
Shiba Inu partnered with Bitget to launch an exclusive SHIB-branded payment card
Shiba Inu announced on Wednesday through its official X account that it has partnered with the Bitget crypto exchange to launch a customized SHIB-themed payment card, enabling users to spend their crypto assets seamlessly for everyday transactions.
This development and partnership indicate that Shiba Inu is expanding its real-world utility by integrating SHIB into mainstream payment channels, which could strengthen user adoption and bolster long-term ecosystem growth.

Shiba Inu’s on-chain and derivatives metrics back a bullish case
Santiment’s Market Value to Realized Value (MVRV) metric is used to identify whether a token is undervalued or overvalued in a given time frame. The 30-day MVRV ratio for SHIB read negative 10.09% on Thursday. This means that SHIB is currently undervalued. The negative MVRV values also could be interpreted as a buy signal, likely increasing buying pressure on the token across crypto exchanges. Historically, when MVRV has dropped to similar levels, the SHIB price has often recovered.
 [09-1763616578662-1763616578665.42.10, 20 Nov, 2025].png)
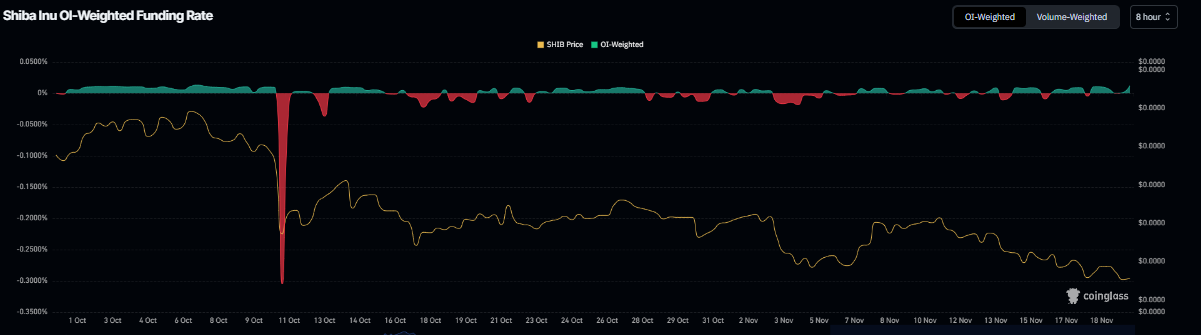
Apart from the undervalued conditions, the derivatives data also support a recovery rally for Shiba Inu. Coinglass’s OI-Weighted Funding Rate data shows that the number of traders betting that the price of SHIB will slide further is lower than those anticipating a price increase.
The metric flipped to a positive rate on Tuesday and currently stands at 0.012% on Thursday, the highest since early October, indicating that longs are paying shorts. Historically, as shown in the chart below, when the funding rates have flipped from negative to positive, SHIB’s price has rallied sharply.
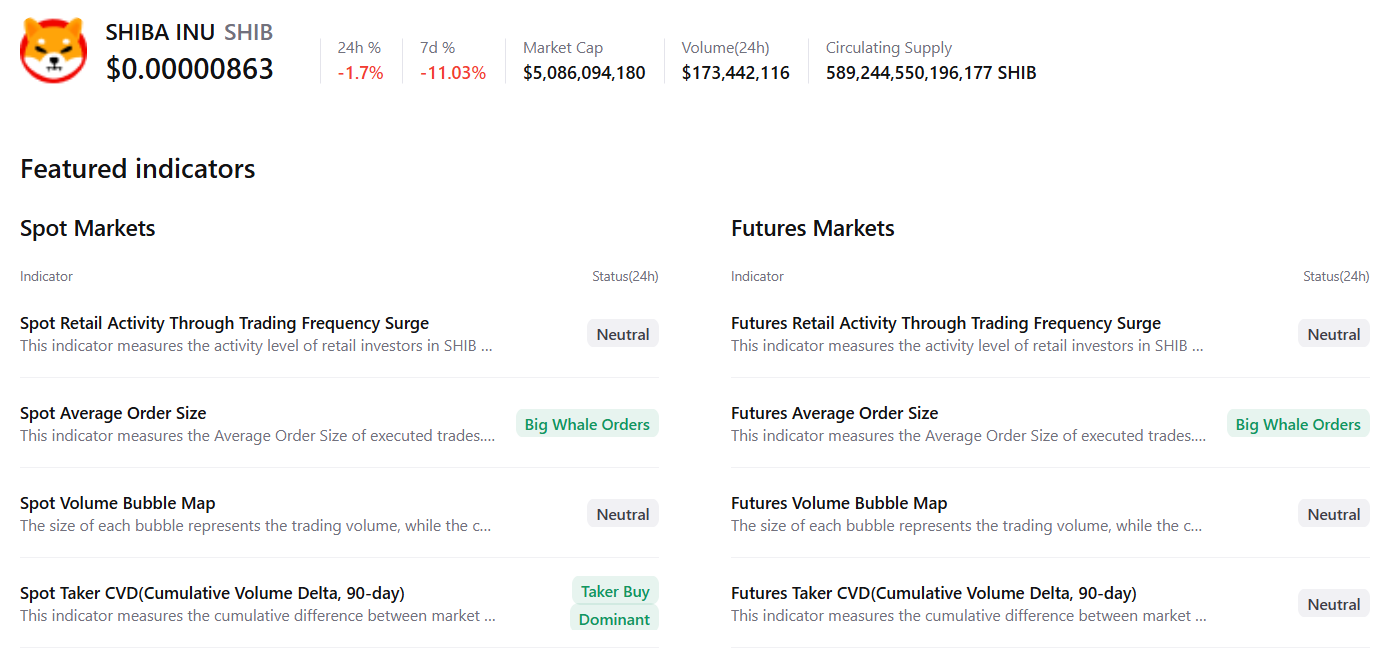
CryptoQuant summary data also supports a positive outlook for Shiba Inu, as spot and futures markets show large whale orders and clear buying dominance in the spot market, collectively signaling that a recovery rally may be forming.
Shiba Inu Price Forecast: RSI shows bullish divergence in play
Shiba Inu price faced rejection around the 50% price retracement level at $0.0000099 on November 13 and declined by nearly 10% until Wednesday. At the time of writing on Thursday, it hovers around $0.0000086.
The daily SHIB’s chart shows a bullish RSI divergence. The formation of a lower low on Wednesday contrasts with the RSI’s higher highs during the same period. This development is termed a bullish divergence and often signals a trend reversal or a short-term rally.
If SHIB recovers, it could extend the advance toward the 50% price retracement level at $0.0000099.
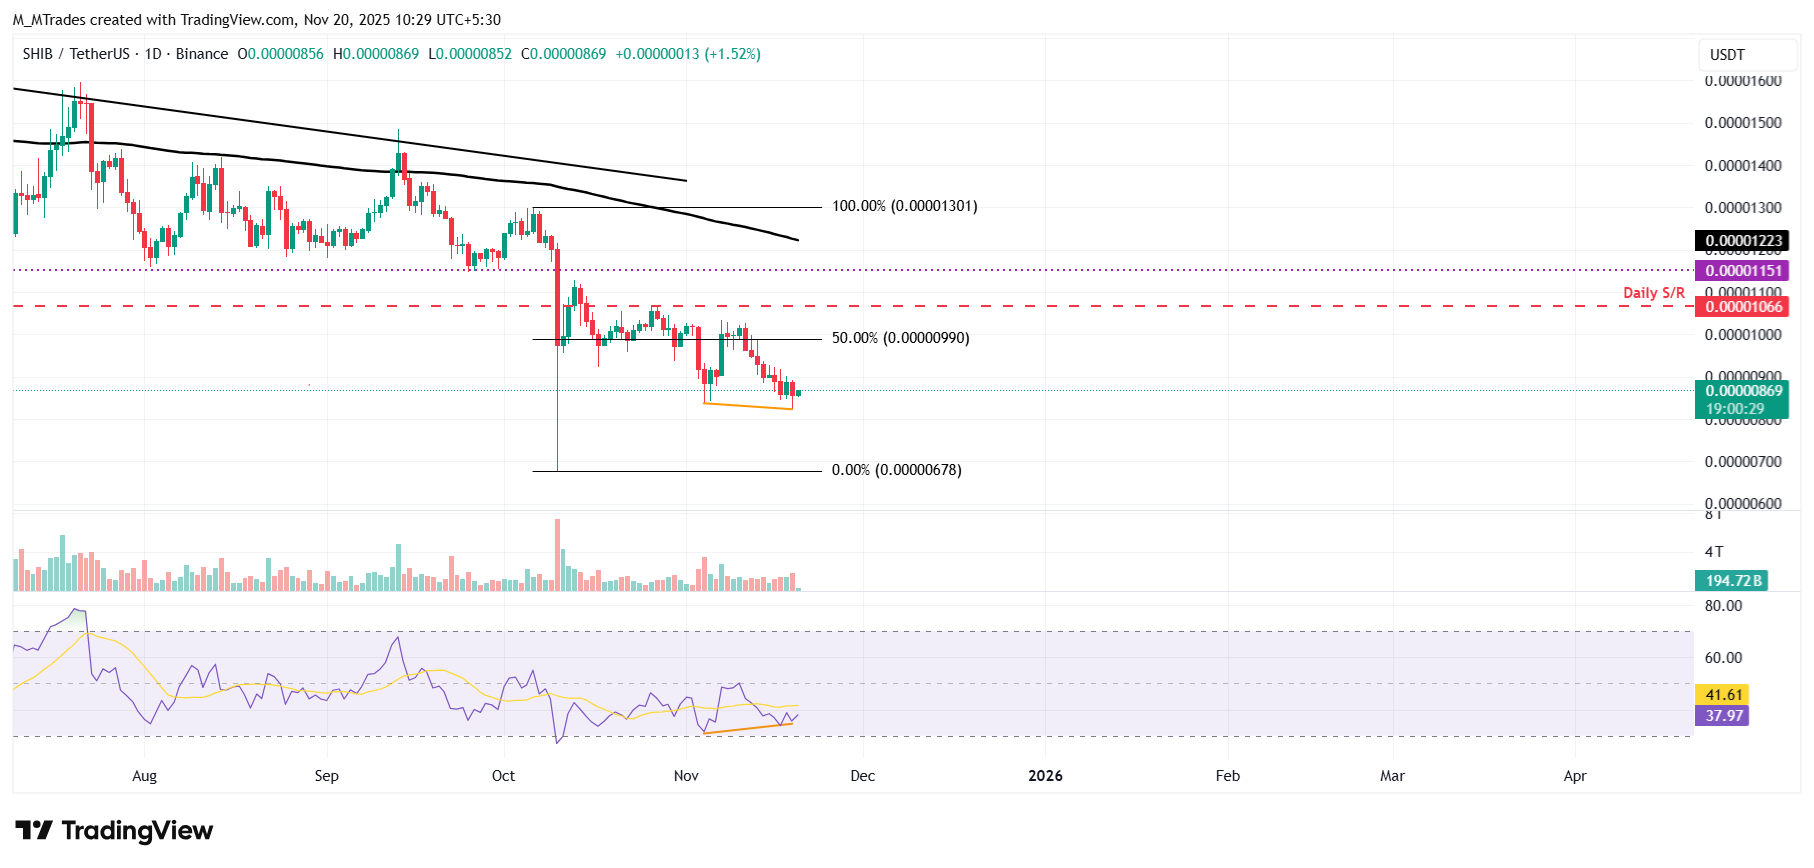
On the other hand, if SHIB faces a correction, it could extend the decline toward Wednesday’s low of $0.0000082.
Author

Manish Chhetri
FXStreet
Manish Chhetri is a crypto specialist with over four years of experience in the cryptocurrency industry.



