Shiba Inu price eyes 30% upswing as SHIB bulls tackle one last hurdle
- Shiba Inu price appears to be preparing for a 30% ascent as it nears a crucial line of resistance.
- Slicing above $0.00003520 could see a compelling upside release for SHIB.
- However, Shiba Inu may be required to tackle multiple obstacles before the bullish target is reached.

Shiba Inu price has shown few clues as to directional intentions as it continues to be sealed within a downtrend within a descending parallel channel on a higher timeframe. However, SHIB could be preparing for a 30% ascent if the bulls manage to escape above a critical line of resistance above $0.00003520.
Shiba Inu price to overcome critical resistance
Shiba Inu price has formed a symmetrical triangle chart pattern on the 4-hour chart, suggesting that SHIB lacks decisiveness.
If the bulls manage to slice above the upper boundary of the governing technical pattern, which intersects with the 21 four-hour Simple Moving Average (SMA) and 23.6% Fibonacci retracement level, Shiba Inu price could expect a big move to the upside.
The prevailing chart pattern suggests a 30% ascent for Shiba Inu price, targeting the upper boundary of the parallel channel. However, SHIB may meet another obstacle at the 50 four-hour SMA at $0.00003592, coinciding with the middle boundary of the parallel channel.
An additional headwind may emerge at the 38.2% Fibonacci retracement level at $0.00003878, which sits near the 100 four-hour SMA and the resistance line given by the Momentum Reversal Indicator (MRI).
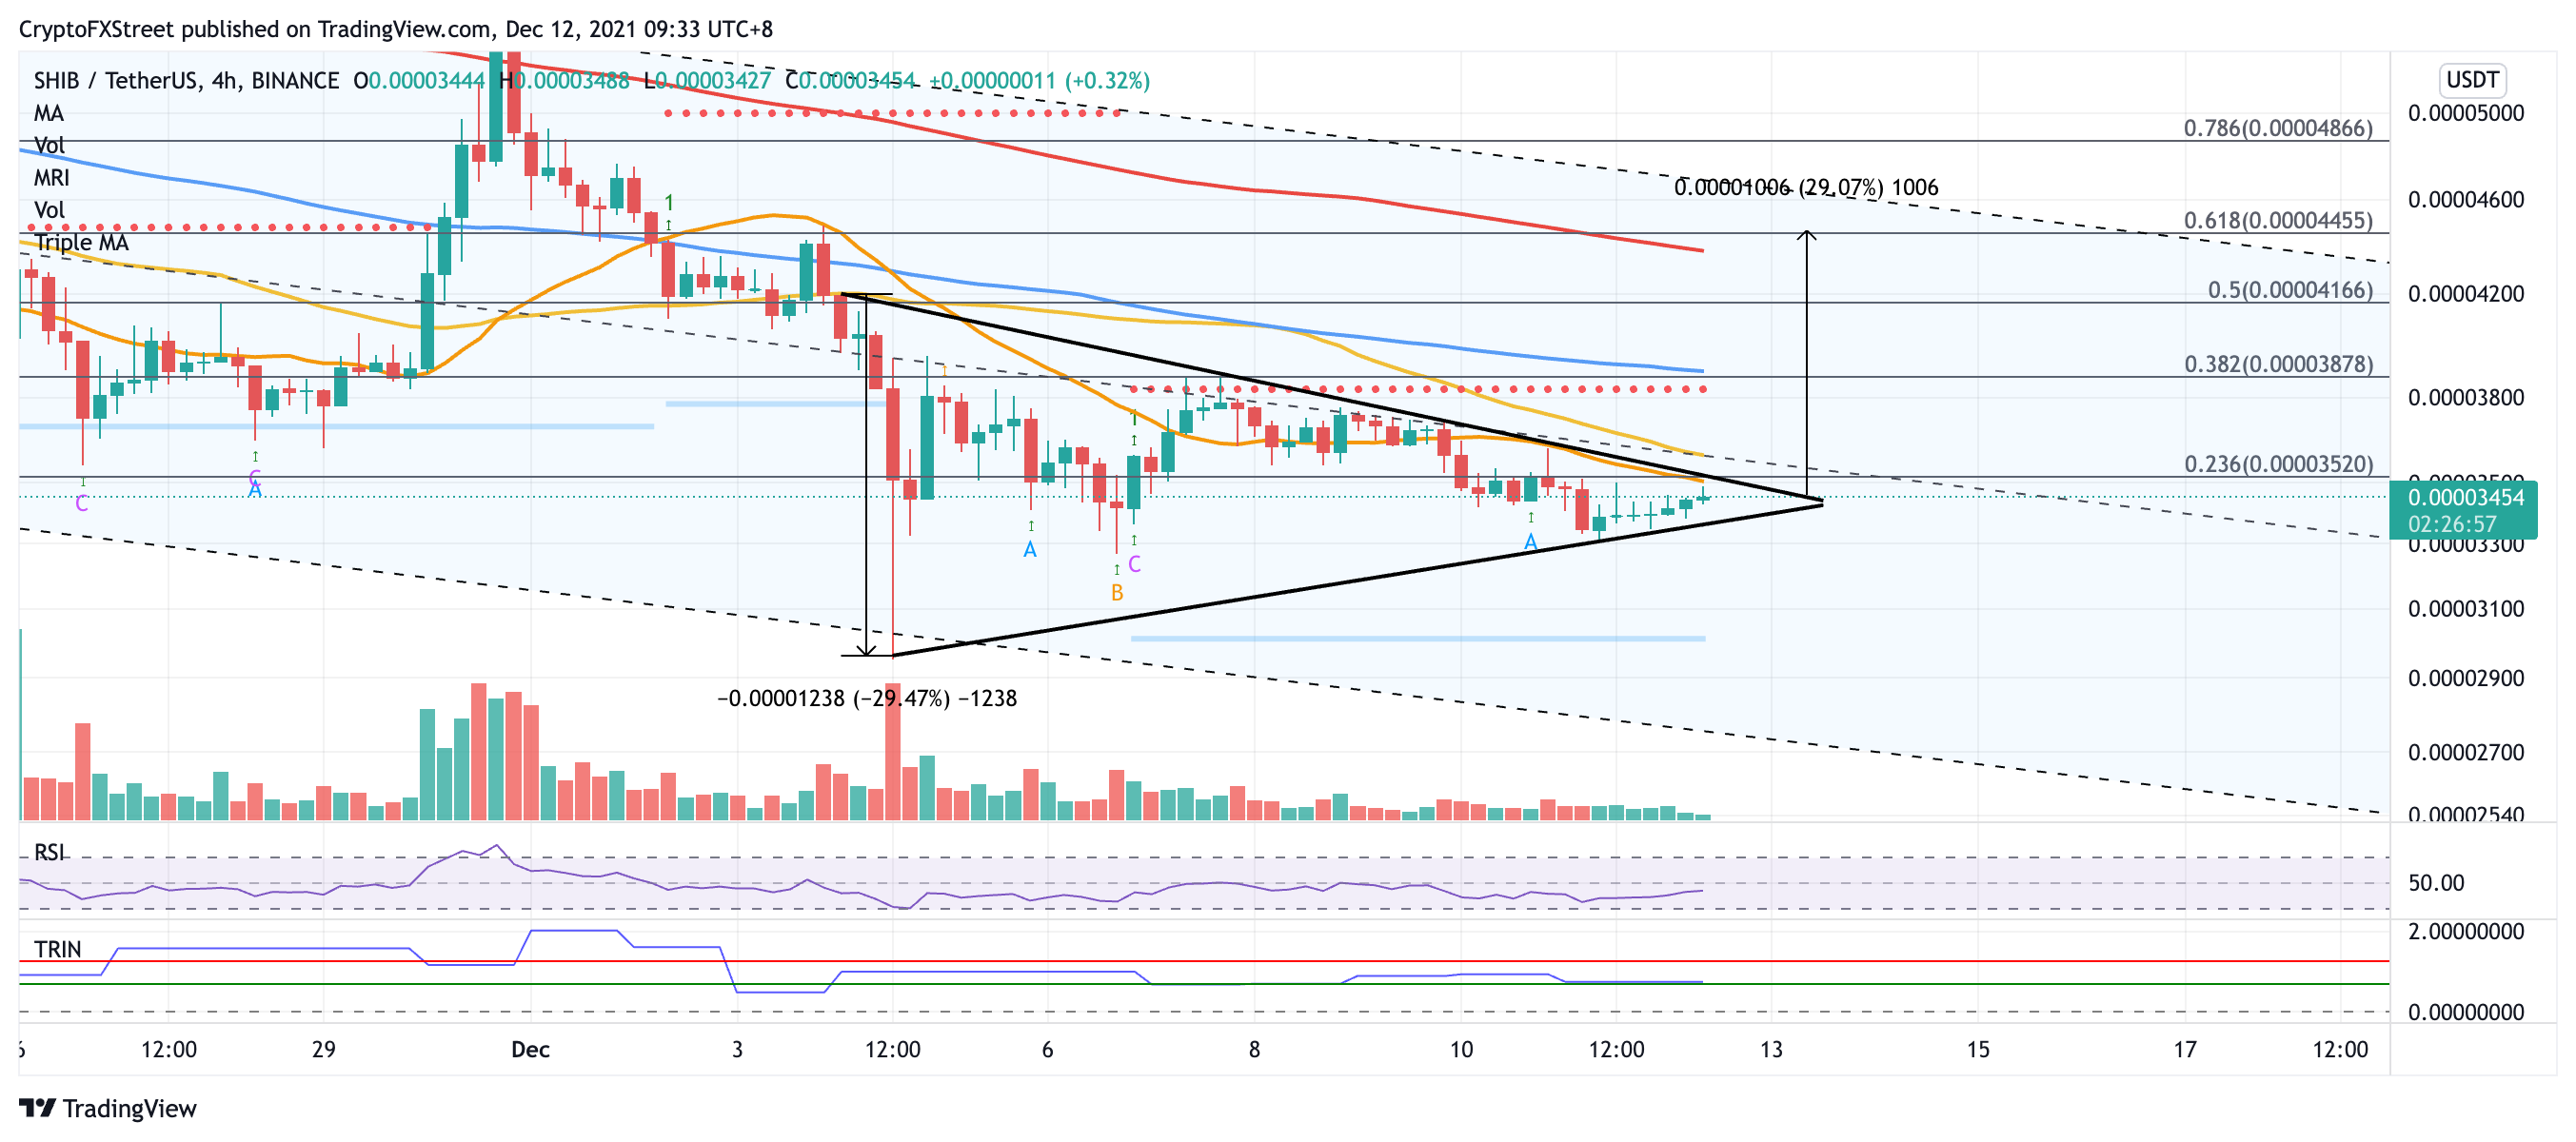
SHIB/USDT 4-hour chart
Before Shiba Inu price could tag the bullish target, SHIB will face obstacles at the 50% retracement level at $0.00004166, then at the 200 four-hour SMA at $0.00004372, then at the 61.8% Fibonacci retracement level at $0.00004455.
However, if selling pressure increases, Shiba Inu price may resort to the lower boundary of the triangle as immediate support at $0.00003358. Additional lines of defense may appear at the December 6 low at $0.00003269, then at the December 4 low at $0.00002952.
Author

Sarah Tran
Independent Analyst
Sarah has closely followed the growth of blockchain technology and its adoption since 2016.



