|

Shiba Inu and Neo Coin Elliott Wave analysis

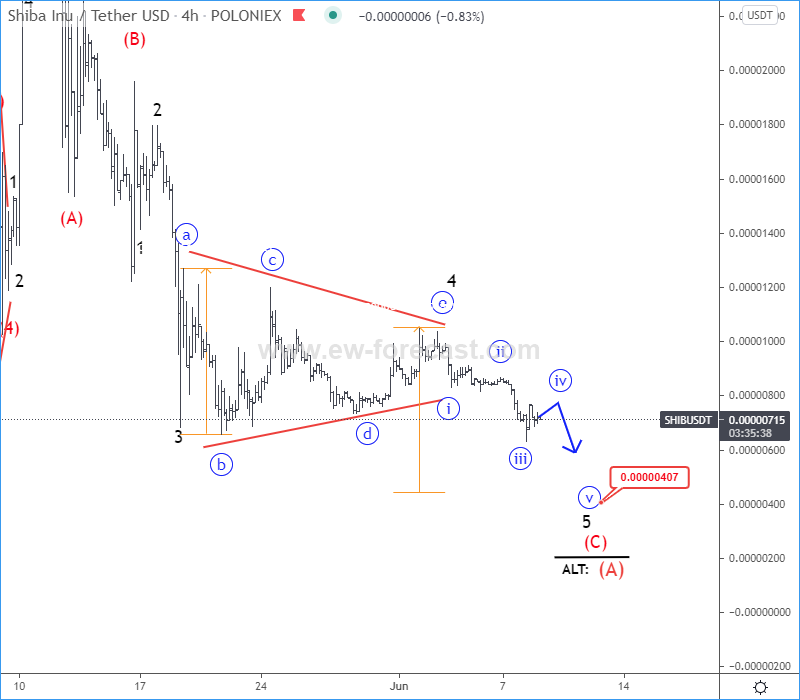
  • Shiba Inu has broken bearish traingle and looks lower towards 0.0000040 area
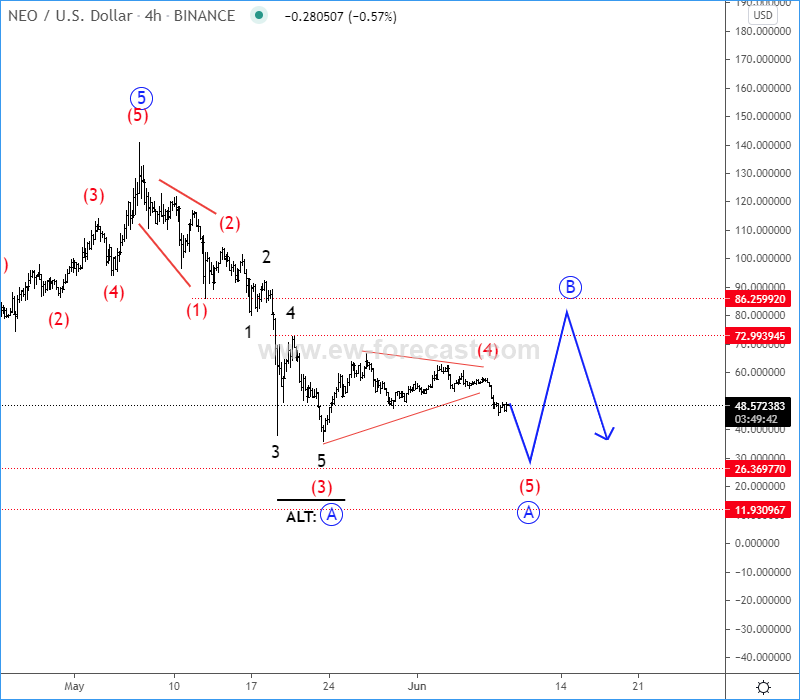
  • Neo moves sideways with in wave (4) correction and can retest the lows for wave (5)

As expected, after we noticed a bearish triangle formation in Shiba Inu (SHIBUSD), it's already back to lows for wave 5, but wave 5 has to be completed with another five-wave cycle of a lower degree, so watch out for more weakness towards 0.0000040 projected triangle target area.
SHIBUSD 4h Elliott Wave Analysis Chart

Shiba Inu Elliott Wave Analysis

Neo NEOUSD is slow and sideways and still looks like wave (4) correction which can retest the lows for wave (5) to complete a higher degree wave A before we will see a recovery in wave B. In case of an earlier recovery, then wave B correction would be already in play.
NEOUSD 4h Elliott Wave Analysis Chart

Neo Elliott Wave Analysis

Finally, another ELLIOTT WAVE OPEN DOOR Event is here. See all of our charts FREE for 10 days. Join us at Elliot Wave Forecast!

Author

Gregor Horvat

Gregor Horvat

Wavetraders

Experience Grega is based in Slovenia and has been in the Forex market since 2003.

More from Gregor Horvat
Share:

Editor's Picks

Crypto Today: Bitcoin, Ethereum, XRP lag recovery as Israel and Iran attack each other

Cryptocurrency prices remain under pressure on Monday as market participants navigate tensions in the Middle East after Israel and Iran attacked each other for the first time since the peace deal agreement that was reached in Early April.

Bitcoin Price Forecast: Institutional selling, Middle East tensions keep BTC under pressure

Bitcoin remains under pressure, struggling below $64,000 on Monday after posting its worst one-week return this year. Institutional sell-off remains severe with spot Exchange Traded Funds recording the fourth week of steady outflows of billions since mid-May.

Hyperliquid rebounds as retail interest offsets first-ever ETF outflows

Hyperliquid price is up 6% at press time on Monday, extending the 5% rebound from the previous day. The rebound aligns with HYPE's regaining retail strength in the derivatives market, offsetting the first-ever daily outflows from Exchange-Traded Funds.

Pi Network extends bearish trend as low volumes stall recovery

Pi Network (PI) price hovers below $0.1300 at press time on Monday, following its sixth consecutive weekly loss of 12%. A declining trend in trading volume shadows the falling PI token prices, reflecting weak demand failing to absorb supply pressure.

Bitcoin: After the bloodbath, everyone looks at $60,000
Bitcoin (BTC) hovers above $62,000 at the time of writing on Friday, weighed down by growing risk-off sentiment due to persistent geopolitical tensions in the Middle East and sticky macroeconomic uncertainty. The institutional sell-off continued to wreak havoc on capital flows, with spot Bitcoin Exchange-Traded Funds (ETFs) recording billions in outflows.