SafeMoon price has a bright future following bullish golden cross
- SafeMoon price is set to pull a bear trap as a false break of the uptrend unfolds.
- SAFEMOON price set to rally back above $0.001100000.
- Expect to see a big squeeze on bears, and a daily close would pull the 21-day SMA above the 55-day SMA making it a golden cross.

SafeMoon (SAFEMOON) price is set to open another can of potential gains and price appreciation as two major technical elements are seen unfolding in the coming trading sessions. The negative close on Monday could turn into a bear trap, as the break to the downside looks fake. Add to that the fact a golden cross may be forming as the 21-day Simple Moving Average (SMA) crosses above the 55-day SMA and it gives a significant bullish signal for traders, suggesting Safemoon price may be on the cusp of a massive long-term uptrend that could lift it back to $0.001800000.
Golden cross to bear 125% gains for SafeMoon
SafeMoon price is on the verge of adding another chapter to its recovery since the rally from mid-May broke through $0.001100000. It then fell back to support found alongside a green ascending trend line that was unfortunately broken in the ASIA PAC session with a close just below it. Plenty of bears will have jumped in after the negative close but they could now be in for a depressing surprise if a bear trap is set. Bulls could easily pull back the price action above the green ascending trend line and squeeze out the eager bears in the process.
SAFEMOON price will then see a rally back towards $0.001000000 which will have repercussions for its moving averages, as it will take the 21-day SMA above the 55-day SMA, forming a golden cross. This technical indicator is often a prelude to more upside potential in the medium-term, which could confirm that SafeMoon price is set to rally towards $0.0018000000. That would mean a whopping 125% price increase as SafeMoon, sets the record straight after its lacklustre performance during the first five months of this year.
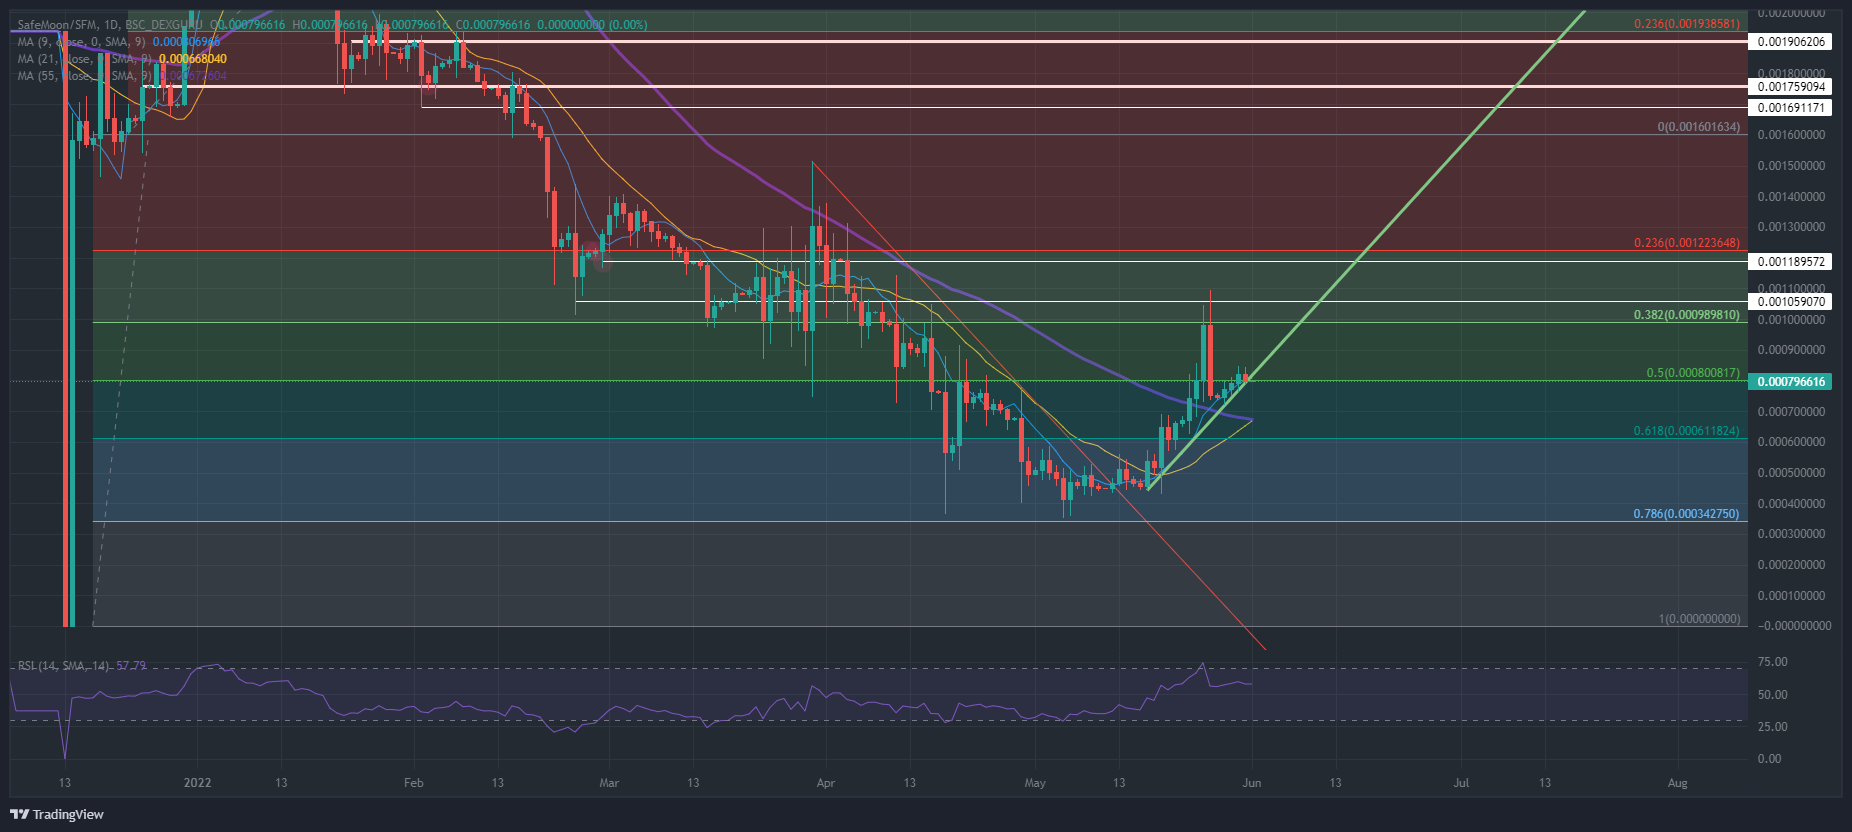
SAFEMOON/USD daily chart
Risk to the downside comes from the potential for increased dollar strength if it bounces off its technical barriers, strength that could weigh on SafeMoon price action. After that, bears could gain momentum and run price action back to the downside, towards $0.000611824, which aligns with the 61.8% Fibonacci level. If the price closes at that level, it will mean the golden cross will have faded and lead to a continuation of the death cross.
Author

Filip Lagaart
FXStreet
Filip Lagaart is a former sales/trader with over 15 years of financial markets expertise under its belt.


