Ripple's XRP Technical Analysis: XRP/USD narrowing price range is subject to explosive breakout
- Ripple's XRP trading broadly flat in the session on Tuesday, up just some 0.60%.
- XRP/USD bulls need to breakdown the $0.4000 area for greater upside.

XRP/USD 15-minute chart
- Price action moving withing a horizontal wedge pattern, having recently been rejected by the upper trend line.
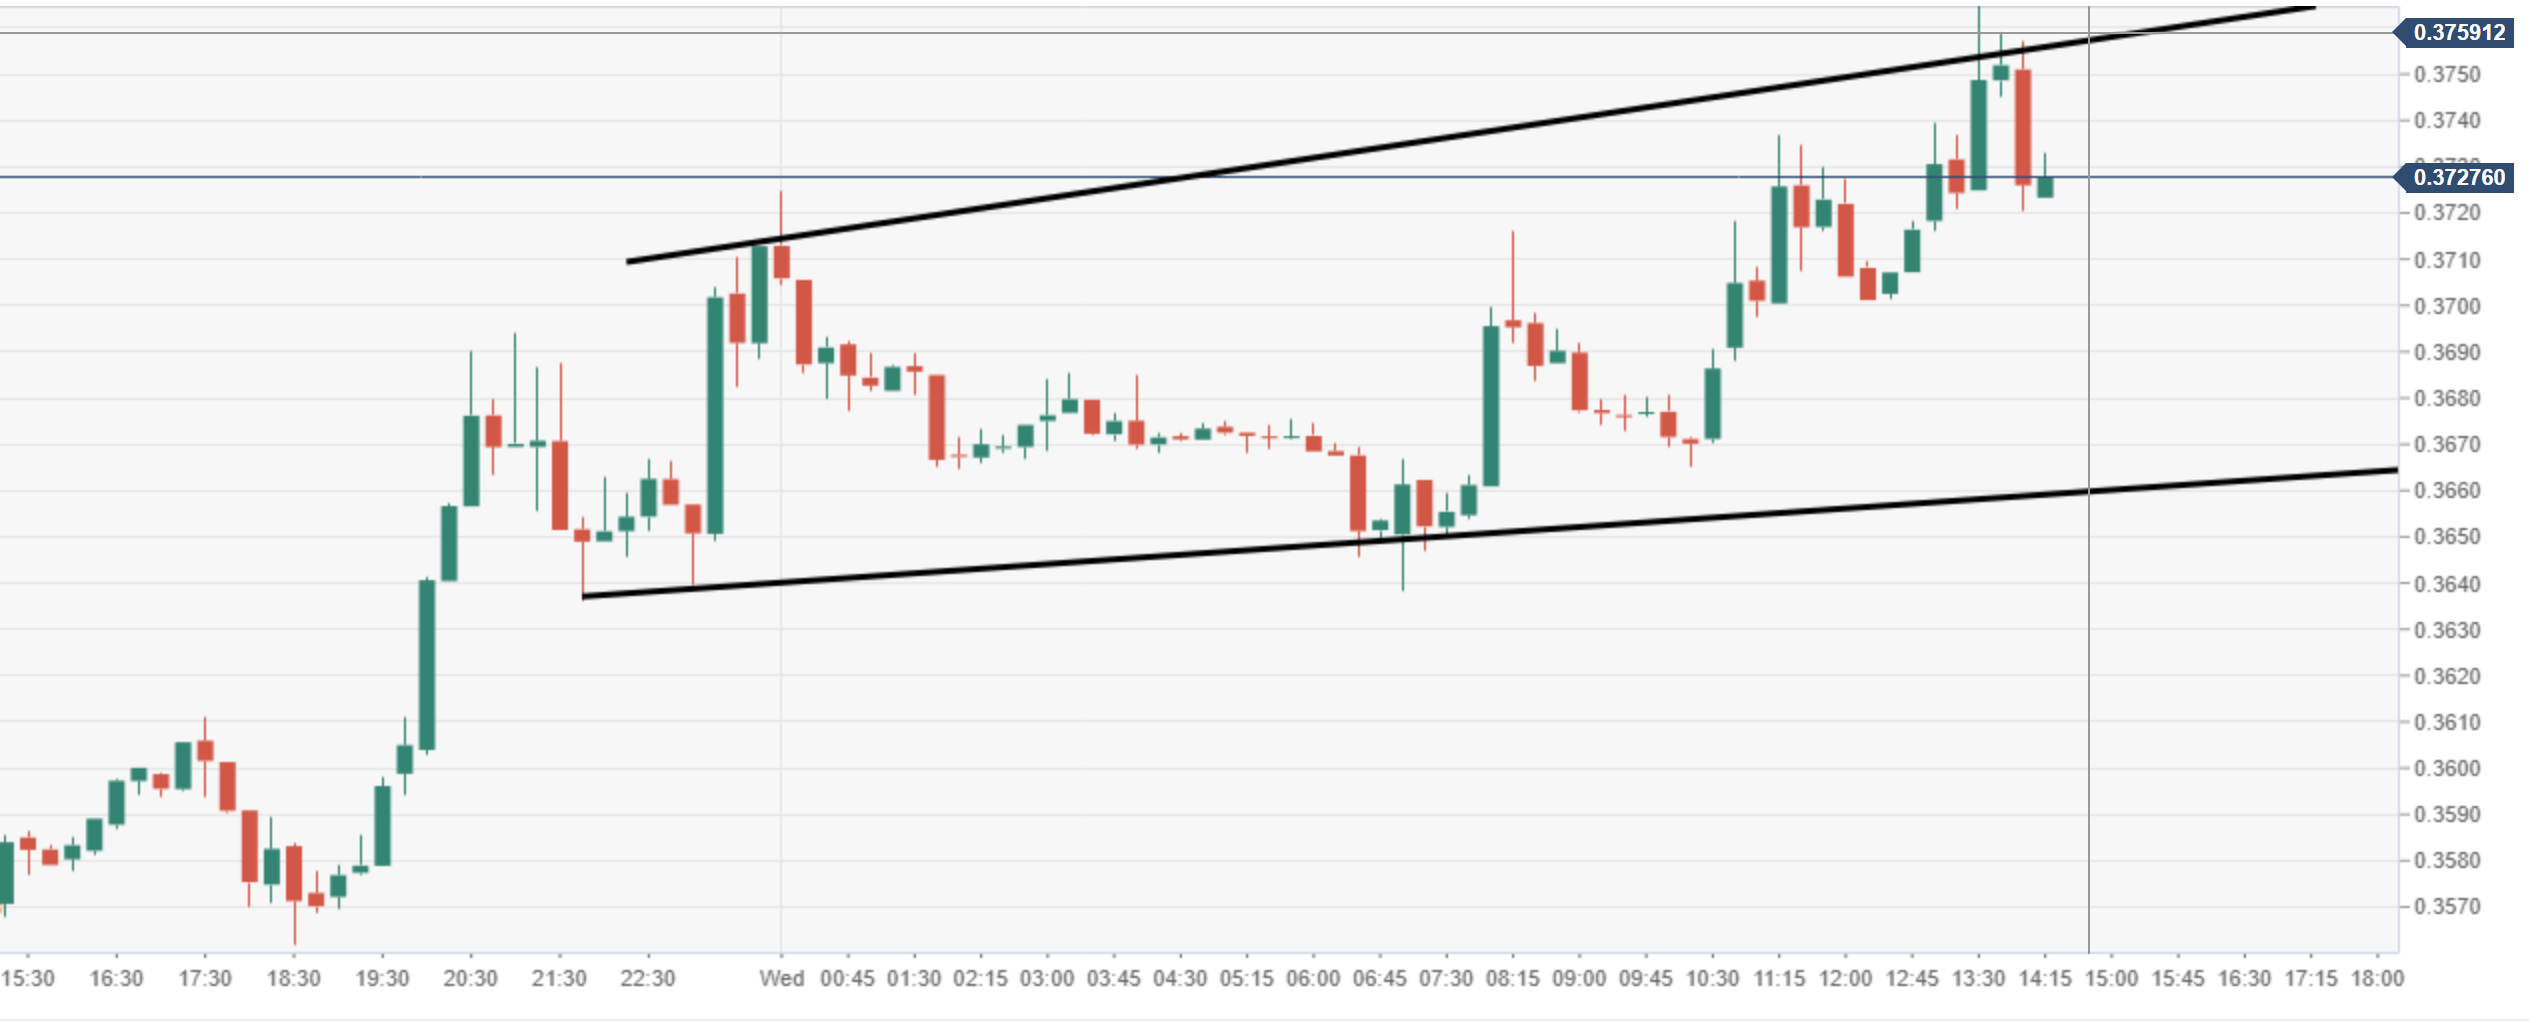
Spot rate: 0.3724
Relative change: +0.65%
High: 0.3765
Low: 0.3638
Trend: Neutral
Support 1: 0.3594, daily pivot point support.
Support 2: 0.3476, daily pivot point support.
Support 3: 0.3416, daily pivot point support.
Resistance 1: 0.3772, daily pivot point resistance.
Resistance 2: 0.3831, daily pivot point resistance.
Resistance 3: 0.3950, daily pivot point resistance.
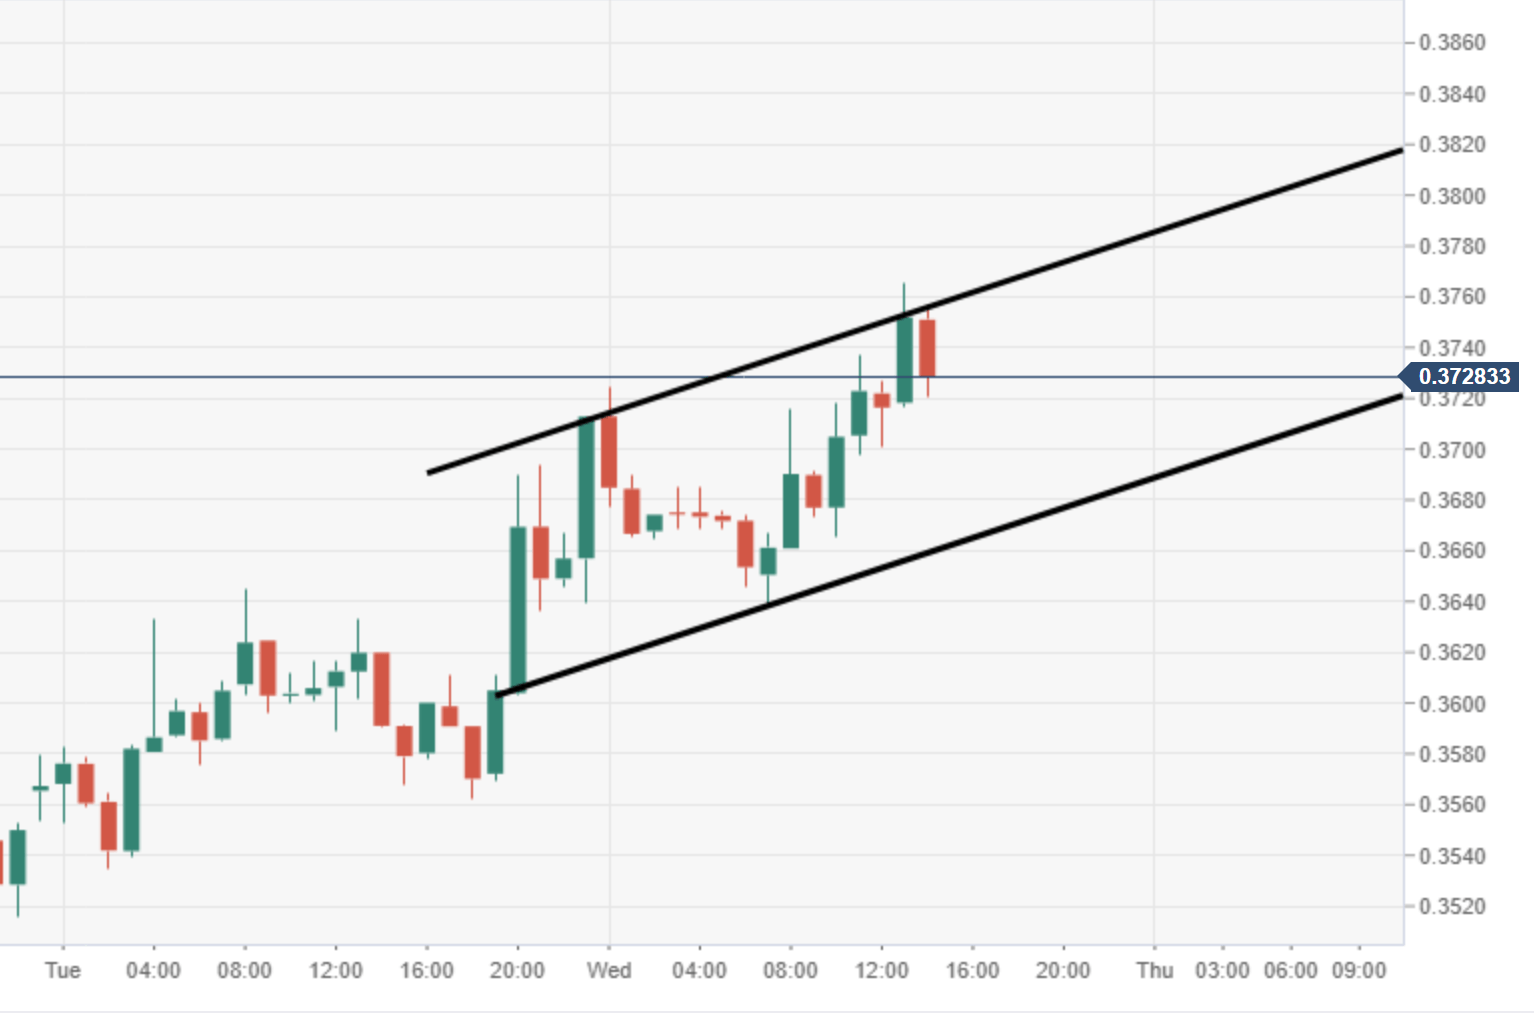
XRP/USD 60-minute chart
- 60-minute chart view shows price moving within a rising channel formation.
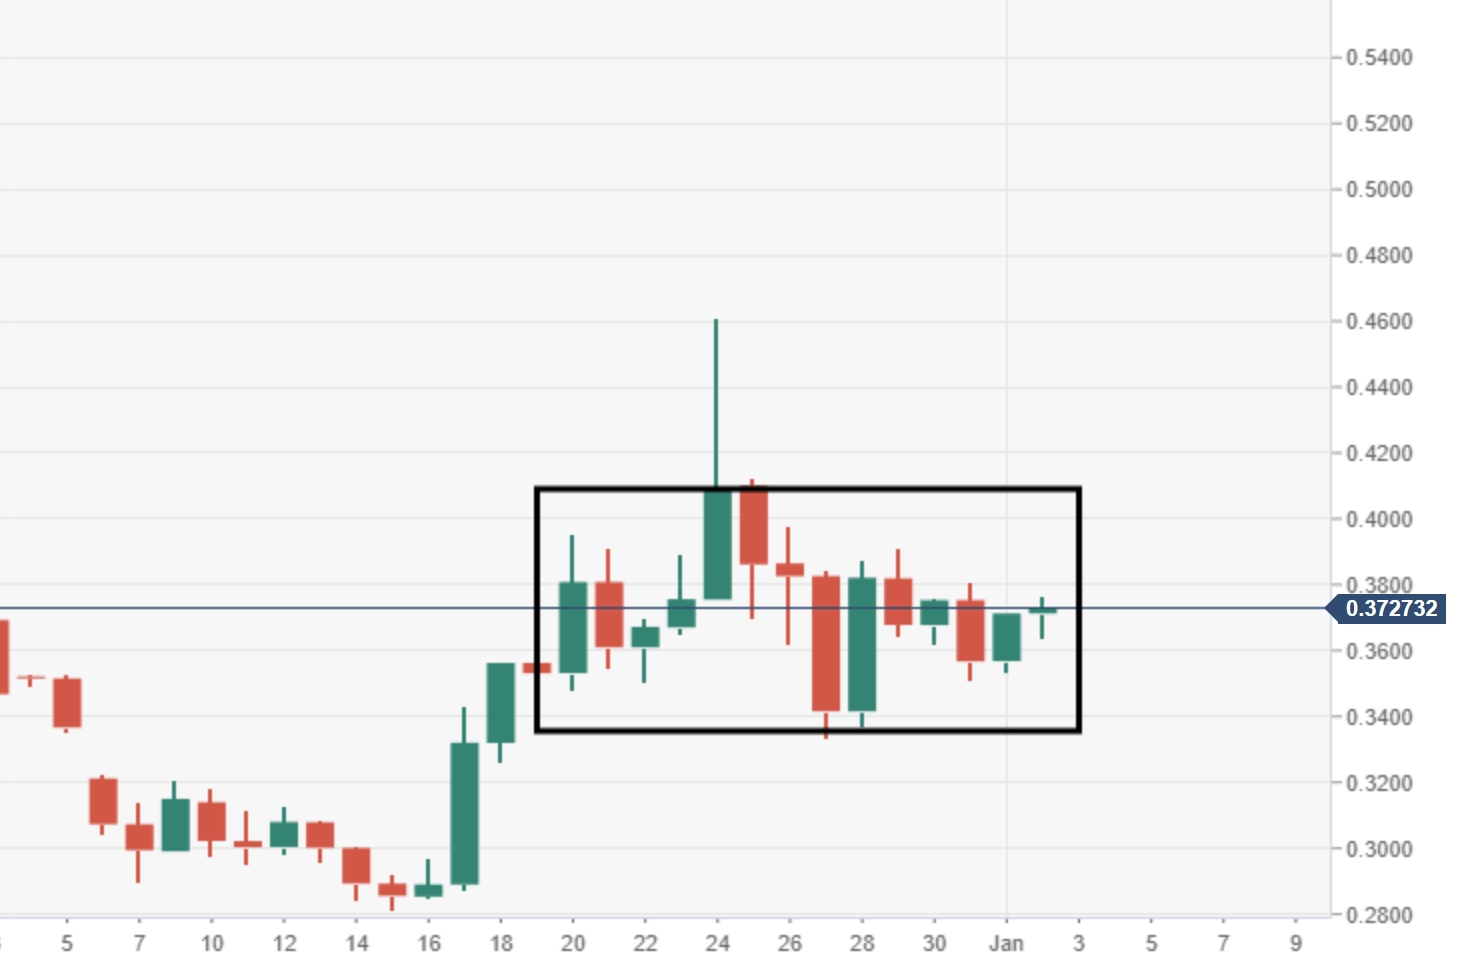
XRP/USD daily chart
- Over the daily chart view, price action moving within a range-block formation.
Author

Ken Chigbo
Independent Analyst
Ken has over 8 years exposure to the financial markets. He started his career as an analyst, covering a variety of asset classes; forex, fixed income, commodities and equities.


