• XRP/USD is currently priced at $0.256 in the early hours of Friday.
  • Over the last three days, XRP/USD has gone down from $0.263 to $0.256.

XRP/USD daily chart

fxsoriginal

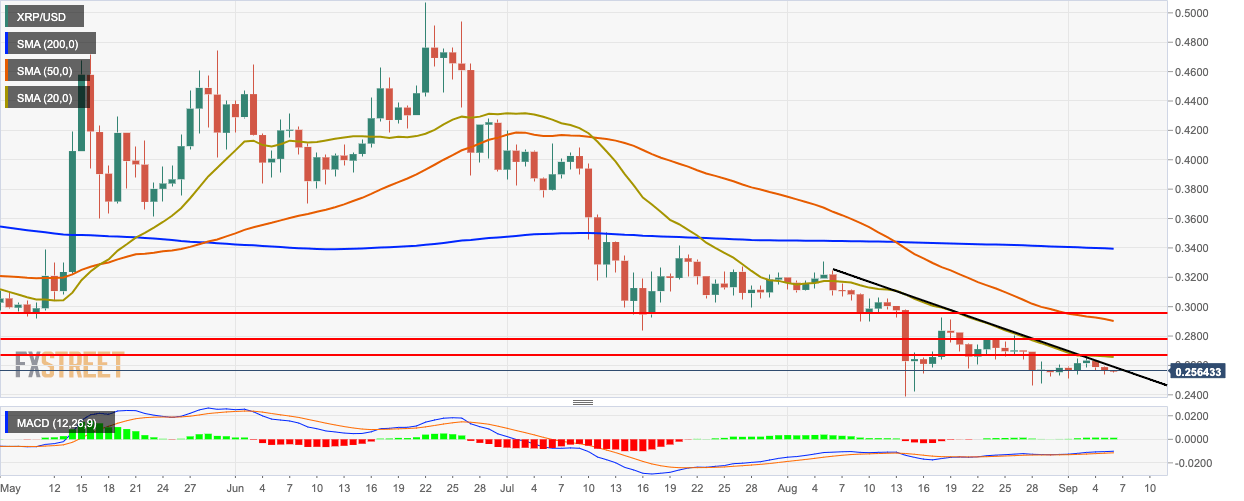
The daily price chart shows us that XRP/USD is on the course of having a third straight bearish day. The price has gone down from $0.263 to $0.256 over the last three days. The price has been checked by the downward trending line and is below the 200-day simple moving average (SMA 200), SMA 50 and SMA 20 curves. The moving average convergence/divergence (MACD) indicator shows sustained bullish sentiment.

XRP/USD 4-hour chart

fxsoriginal

The 4-hour price chart is trending below the green Ichimoku cloud. It is also trending below the SMA 200, SMA 50 and SMA 20 curves. The price has found support on the $0.254 line and needs to overcome resistance at the $0.258. The Elliott oscillator shows 12 straight bearish sessions.

XRP/USD hourly chart

fxsoriginal

The hourly chart shows that the latest session was bullish enough to break above the resistance provided by the SMA 20 curve. The 20-day Bollinger jaw is constricting, indicating decreasing market volatility. The relative strength index (RSI) indicator is trending around 50.

Key Levels

XRP/USD

Overview
Today last price 0.2562
Today Daily Change -0.0003
Today Daily Change % -0.12
Today daily open 0.2565
 
Trends
Daily SMA20 0.2663
Daily SMA50 0.2916
Daily SMA100 0.3477
Daily SMA200 0.3397
Levels
Previous Daily High 0.2595
Previous Daily Low 0.2536
Previous Weekly High 0.2805
Previous Weekly Low 0.2463
Previous Monthly High 0.3308
Previous Monthly Low 0.2392
Daily Fibonacci 38.2% 0.2559
Daily Fibonacci 61.8% 0.2573
Daily Pivot Point S1 0.2536
Daily Pivot Point S2 0.2507
Daily Pivot Point S3 0.2477
Daily Pivot Point R1 0.2594
Daily Pivot Point R2 0.2624
Daily Pivot Point R3 0.2653


Note: All information on this page is subject to change. The use of this website constitutes acceptance of our user agreement. Please read our privacy policy and legal disclaimer. Opinions expressed at FXstreet.com are those of the individual authors and do not necessarily represent the opinion of FXstreet.com or its management. Risk Disclosure: Trading foreign exchange on margin carries a high level of risk, and may not be suitable for all investors. The high degree of leverage can work against you as well as for you. Before deciding to invest in foreign exchange you should carefully consider your investment objectives, level of experience, and risk appetite. The possibility exists that you could sustain a loss of some or all of your initial investment and therefore you should not invest money that you cannot afford to lose. You should be aware of all the risks associated with foreign exchange trading, and seek advice from an independent financial advisor if you have any doubts.

Join Telegram

Recommended content


Recommended Content

Editors’ Picks

Ripple wipes out weekly gains, experts comment on role of Ripple stablecoin

Ripple wipes out weekly gains, experts comment on role of Ripple stablecoin

Ripple declined to $0.52 on Thursday, erasing all gains registered earlier this week. Ripple SVP Eric van Miltenburg’s comments on the firm’s stablecoin, and how it is expected to benefit the XRP Ledger and native token XRP have raised concerns among crypto experts. 

More Ripple News

Hedera HBAR slips nearly 10% after air is cleared on mistaken link with giant BlackRock

Hedera HBAR slips nearly 10% after air is cleared on mistaken link with giant BlackRock

HBAR price is down nearly 10% on Thursday, partly erasing gains inspired by the misinterpreted link with BlackRock. Despite the recent correction, Hedera’s price is up 44% in the past seven days.

More Hedera News

The reason behind Bonk’s 105% rise and if you should buy now Premium

The reason behind Bonk’s 105% rise and if you should buy now

Bonk price has shot up 105% in the past five weeks. A retracement into $0.0000216 or the $0.0000152 to $0.0000186 imbalance would be a good buying opportunity. Patient investors can expect double-digit gains from BONK that could extend up to 70%.

More Cryptocurrencies News

Injective price weakness persists despite over 5.9 million INJ tokens burned

Injective price weakness persists despite over 5.9 million INJ tokens burned

Injective price is trading with a bearish bias, stuck in the lower section of the market range. The bearish outlook abounds despite the network's deflationary efforts to pump the price. Coupled with broader market gloom, INJ token’s doomed days may not be over yet.

More Injective News

Bitcoin: BTC post-halving rally could be partially priced in Premium

Bitcoin: BTC post-halving rally could be partially priced in

Bitcoin (BTC) price briefly slipped below the $60,000 level for the last three days, attracting buyers in this area as the fourth BTC halving is due in a few hours. Is the halving priced in for Bitcoin? Or will the pioneer crypto note more gains in the coming days? 

Read full analysis

BTC

ETH

XRP