|

Ripple Price Prediction: Stuck in a rising channel, risks a drop to 200-HMA

  • Ripple meets fresh supply once again above $0.16 on Sunday.
  • Technical set up points to a bearish bias in the near-term.
  • XRP bulls need a daily closing above $0.16 for sustained move higher.

Ripple (XRP/USD) is trying hard to build onto Saturday’s advance, but the bulls appear to lack vigor so far this Sunday. Sellers continue to lurk above the 0.16 handle, making it very difficult for the coin to extend Friday’s recovery from 0.1450 levels. The third-most favorite cryptocurrency rose as high as 0.1618 before reversing towards the intraday low of 0.1566. The coin, currently, exchanges hands at 0.1580, having shaved off the early gains while up 2.50% over the last 24 hours. Its market capitalization stands at $ 7.03 billion.

Short-term technical outlook

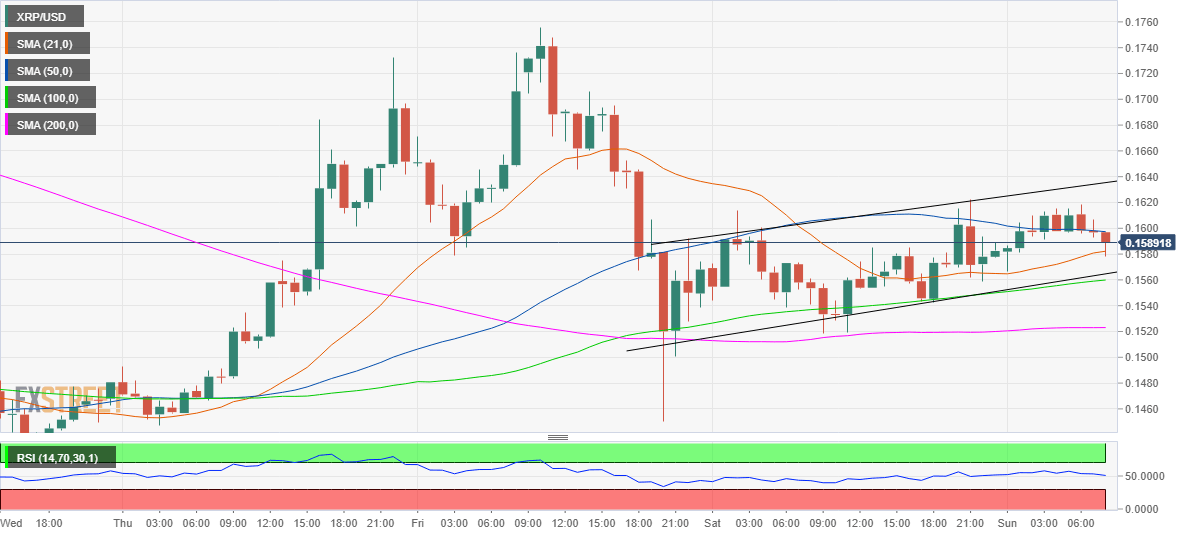
Looking at the hourly sticks, the price traverses within a rising channel formation, having fallen back the 50-hourly Simple Moving Average (HMA) at 0.1597.  Thereafter, the coin briefly tested the immediate support of the 21-HMA at 0.1581, as the hourly Relative Strength Index (RSI) inched lower to challenge the mid-line at 50.0. Should the selling pressure intensify, the next support near 0.1560 region, the confluence of the upward sloping 100-HMA, channel support and daily low, will be put at risk. The rising channel breakdown will get confirmed on an hourly close below the latter, opening floors for a test of the horizontal 200-HMA at 0.1523.

Alternatively, should the bulls manage to defend the 0.1560 zone, a bounce back to the 0.1600 level cannot be ruled, beyond which Saturday’s high of 0.1622 and then the channel resistance at 0.1635 could be on the buyers’ radar.

XRP/USD 1-hour chart


XRP/USD key levels to consider

XRP/USD

Overview
Today last price0.1589
Today Daily Change0.0002
Today Daily Change %0.13
Today daily open0.1582
 
Trends
Daily SMA200.189
Daily SMA500.2393
Daily SMA1000.2257
Daily SMA2000.2442
 
Levels
Previous Daily High0.1622
Previous Daily Low0.1519
Previous Weekly High0.1756
Previous Weekly Low0.1283
Previous Monthly High0.3467
Previous Monthly Low0.2245
Daily Fibonacci 38.2%0.1582
Daily Fibonacci 61.8%0.1558
Daily Pivot Point S10.1527
Daily Pivot Point S20.1471
Daily Pivot Point S30.1423
Daily Pivot Point R10.163
Daily Pivot Point R20.1678
Daily Pivot Point R30.1734

Author

Dhwani Mehta

Dhwani Mehta

FXStreet

Residing in Mumbai (India), Dhwani is a Senior Analyst and Manager of the Asian session at FXStreet. She has over 10 years of experience in analyzing and covering the global financial markets, with specialization in Forex and commodities markets.

More from Dhwani Mehta
Share:

Editor's Picks

Crypto Today: Bitcoin at $60,000, Ethereum at $1,500, and XRP at $1 face a make-or-break test

Bitcoin (BTC), Ethereum (ETH), and Ripple (XRP) are trading in the red on Friday after three consecutive days of losses, testing their respective make-or-break support levels.

Bitcoin Weekly Forecast: BTC hits 20-month low, will the pain continue?

Bitcoin recovers slightly, trading at $66,000 on Friday after reaching a new yearly low of $58,115 earlier this week, its lowest level since October 2024. Institutional selling intensified as spot ETFs recorded $1.35 billion in net outflows through Thursday.

XRP clings to $1 as long liquidations deepen bearish trend

Ripple trades near the key psychological support level of $1 at the time of writing on Friday after losing more than 8% so far this week. CoinGlass liquidation data shows that over 97% XRP long positions were wiped out over the past 24 hours.

Pi Network Price Forecast: Minor recovery amid market crash fuels short-term hope

Pi Network price records a mild 3% recovery at press time on Friday, shaping a rebound from a broken descending trendline. The declining trend in trading volume has stabilized around $10 million this week, supporting the possibility of an extended recovery as selling pressure wanes.

Bitcoin: BTC hits 20-month low, will the pain continue?
Bitcoin (BTC) recovers slightly, trading at $66,000 on Friday after reaching a new yearly low of $58,115 earlier this week, its lowest level since October 2024. Institutional selling intensified as spot Exchange Traded Funds (ETFs) recorded $1.35 billion in net outflows through Thursday.