Ripple Price Prediction: $0.28 back in sight amid a potential bear flag
- Ripple consolidates the bounce from Saturday’s sell-off.
- A stack of resistance levels caps the upside with bearish RSI.
- 0.3254 is the level to beat for a bullish reversal in XRP/USD.

Having seen a sharp correction from a seven-month high of 0.3466 on Saturday, Ripple (XRP/USD) is making recovery attempts in a bid to regain the 0.32 handle this Sunday. The third-most traded cryptocurrency fell as low as 0.2942 after the sellers took control below a break of the 0.33 level. Despite the renewed uptick, the coin is down over 6% in the last 24 hours while enjoying a market capitalization of about $ 13.76 billion.
Short-term technical outlook
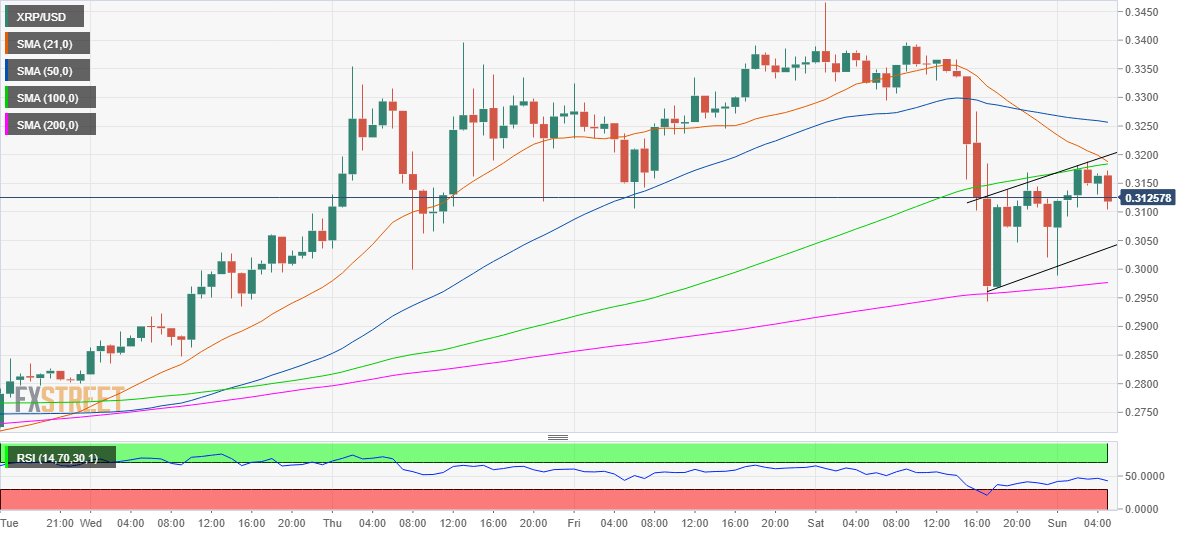
As observed in the hourly chart, the price wavers within a rising channel following the meltdown overnight, charting a potential bearish flag pattern. The bearish continuation pattern will get validated should the spot yield an hourly close below the rising trend line support at 0.3036.
The selling pressure will intensify below the latter, opening floors for a retest of the key support area around 0.2976-0.2942, the confluence of the upward sloping 200-hourly Simple Moving Average (HMA) and Saturday’s low. A failure to resist the said demand zone, the pattern target at 0.2820 will be on the sellers’ radar. The hourly Relative Strength Index (RSI) trades below the mid-line and points lower, suggesting that there is further scope to the downside.
Alternatively, the bulls need to take out the immediate resistance located between 0.3185-0.3200 (intersection of 21, 100-HMAs and rising channel resistance) in order to regain the bearish 50-HMA at 0.3254 to confirm a bullish reversal.
All in all, the path of least resistance appears to the downside amid a bearish pattern formation and a cluster of strong upside barriers stacked up for the bulls to clear. At the press time, XRP/USD rises 1.65% to trade around the 0.3125 region.
XRP/USD 1-hour chart
XRP/USD key levels to consider
Author

Dhwani Mehta
FXStreet
Residing in Mumbai (India), Dhwani is a Senior Analyst and Manager of the Asian session at FXStreet. She has over 10 years of experience in analyzing and covering the global financial markets, with specialization in Forex and commodities markets.


