- Ripple price closed back above the 200-day SMA after equities triggered a turnaround.
- XRP traders will be on edge today as US PPI numbers will be crucial for the last three weeks of 2022.
- Should PPI drop substantially lower than last month, expect a jump of 6% on Friday afternoon.
Ripple price will be very muted Friday morning as traders are bracing to take or leave the last chance to get this Christmas rally underway. With the US Producer Price Index (PPI) coming out Friday afternoon, global markets will look for indications that prices in the US are coming further down, opening up room for the Fed to become less aggressive. This would revalue several asset classes higher than where they are currently valued, translating to XRP price producing a 7% gain in one trading day with $0.4228 as the profit target.
XRP in make-or-break mode
Ripple price got a surprise tailwind from US equities on Thursday, where the European session could not tie up with gains. US equities rallied firmly higher overnight following comments from Treasury Secretary Janet Yellen fired up markets after she confirmed inflation is coming down and a recession could be avoided in the US. Analyst consensus for this afternoon is a lower PPI number this afternoon, which would confirm that view from Janet Yellen and see markets front-running the inflation number .
XRP price is currently supported with the 200-day Simple Moving Average (SMA) at $0.3896 and is still holding for now. Expect not to see any big moves until this afternoon around 14:30 CET (8:30am EST), when the PPI number comes out. Depending on the decline of the PPI, expect to see a jump to the 55-day SMA at $0.42, and bulls may test that higher level from mid-November before springing toward $0.48 in the coming weeks.
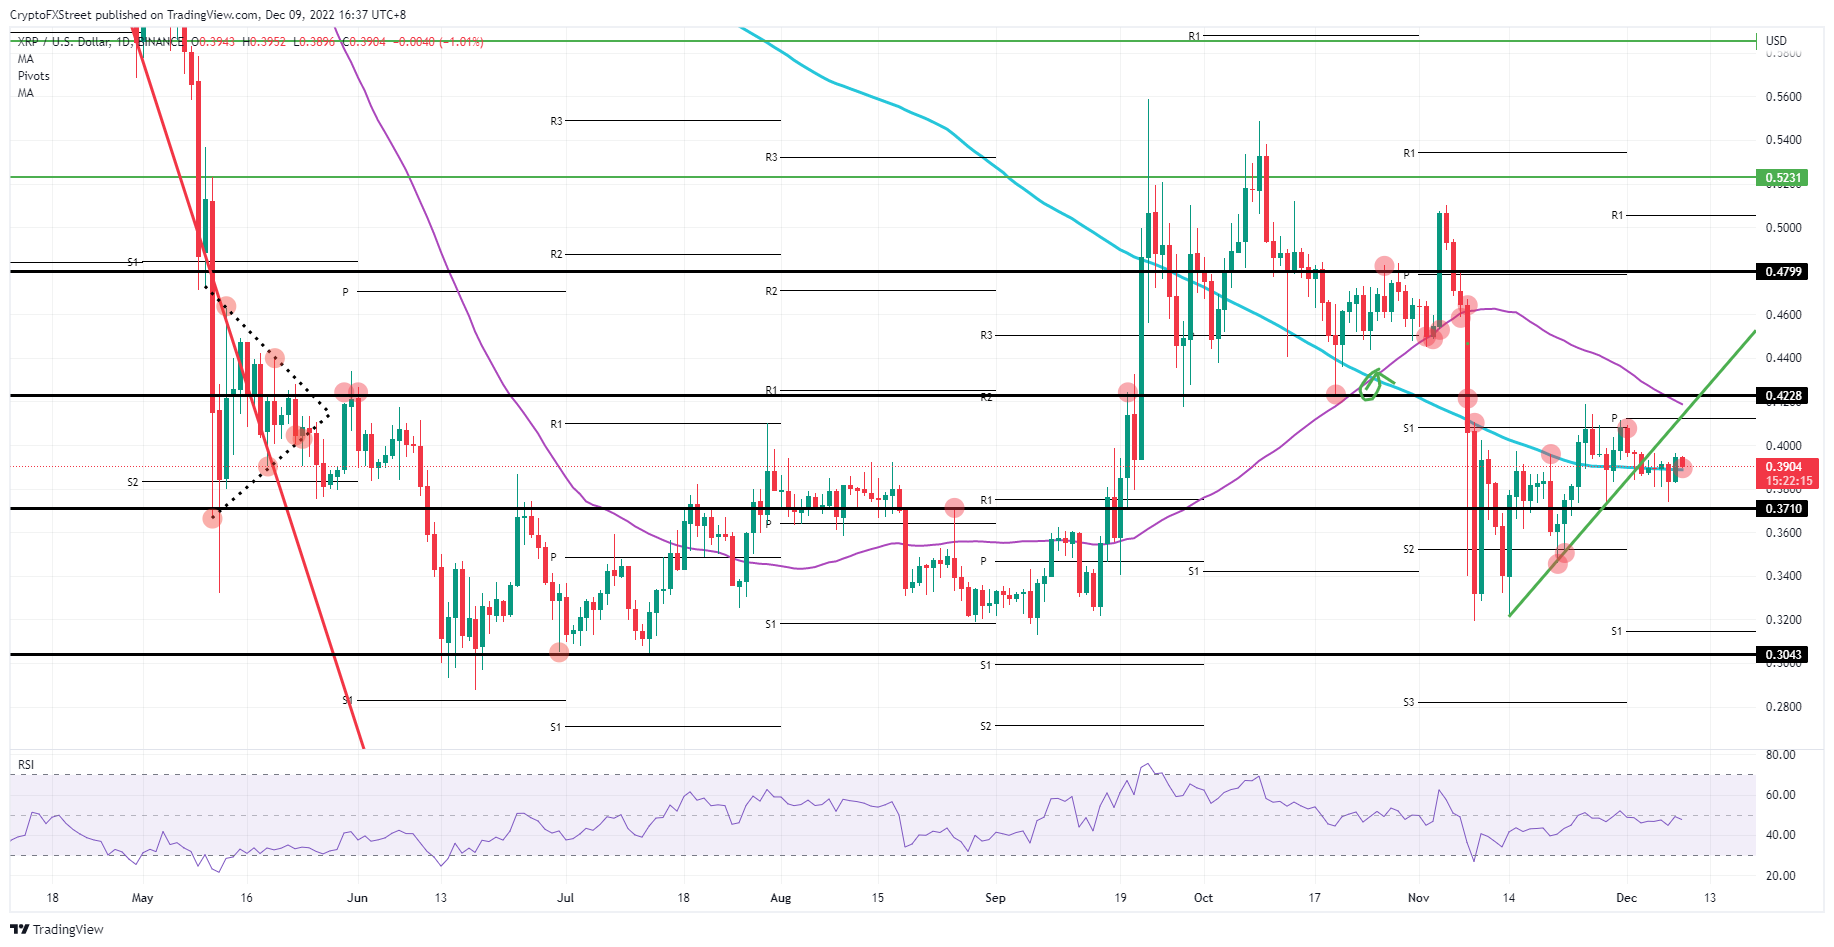
XRP/USD daily chart
Risk comes with a buy-the-rumor-sell-the-fact element as markets are already following and have been pricing in the view of analysts that see the PPI number lower. A number in line or a slightly higher number could break the sentiment and trigger a sell-off on the disappointment. The 200-day SMA would lose its support and see the price breaking down to $0.3710, possibly dipping even briefly to $0.36.
Information on these pages contains forward-looking statements that involve risks and uncertainties. Markets and instruments profiled on this page are for informational purposes only and should not in any way come across as a recommendation to buy or sell in these assets. You should do your own thorough research before making any investment decisions. FXStreet does not in any way guarantee that this information is free from mistakes, errors, or material misstatements. It also does not guarantee that this information is of a timely nature. Investing in Open Markets involves a great deal of risk, including the loss of all or a portion of your investment, as well as emotional distress. All risks, losses and costs associated with investing, including total loss of principal, are your responsibility. The views and opinions expressed in this article are those of the authors and do not necessarily reflect the official policy or position of FXStreet nor its advertisers. The author will not be held responsible for information that is found at the end of links posted on this page.
If not otherwise explicitly mentioned in the body of the article, at the time of writing, the author has no position in any stock mentioned in this article and no business relationship with any company mentioned. The author has not received compensation for writing this article, other than from FXStreet.
FXStreet and the author do not provide personalized recommendations. The author makes no representations as to the accuracy, completeness, or suitability of this information. FXStreet and the author will not be liable for any errors, omissions or any losses, injuries or damages arising from this information and its display or use. Errors and omissions excepted.
The author and FXStreet are not registered investment advisors and nothing in this article is intended to be investment advice.
Recommended Content
Editors’ Picks
Ripple's move above this key level could trigger nearly 50% rally for XRP
Ripple has overcome a critical resistance level and flipped into a support floor on the weekly time frame. This development happened while XRP tightly consolidated for roughly 250 days. Investors can expect XRP to kickstart a massive rally.
Optimism price outlook with nearly $90 million worth of OP tokens flooding markets on Friday
Optimism volatility has shrunk in the ours leading to the network’s cliff unlock. It joins the likes of dYdX and Sui, which have similar events on their calendars. As token unlocks are often considered bearish catalysts, investors should brace for a reaction after the event.
Top 3 Price Prediction Bitcoin, Ethereum, Ripple: Retail watches from the sidelines with a bias for shorts
Bitcoin could clear $73,777 peak as BTC bulls resurface. Ethereum might fall 10% before next leg up as ETH RSI teases with sell signal. XRP could lose $0.6000 threshold as Ripple bulls fail to show up.
Jito price could hit $6 as JTO coils up inside this bullish pattern
Jito price action shows a potential cup and handle formation. Based on theoretical measurement rules, a successful breakout could yield a 56% rally to $6.0. A breakdown of the $3.86 support level would create a lower low for JTO and invalidate the bullish thesis.
Bitcoin: BTC may have recovered, but is it out of the woods?
Bitcoin’s (BTC) upward momentum has shown a significant decline for the past two weeks or so. This development led to a bearish signal on the weekly and an uncertain outlook on the monthly.