XRP weekly fund inflows surge as recovery gains momentum
- XRP regains momentum, rising above $2.50 on Monday.
- XRP investment product inflows averaged $28 million last week, signaling a return to risk-on sentiment.
- The short-term technical picture turns bullish, supported by a MACD buy signal and an uptrending RSI.

Ripple (XRP) rises alongside crypto majors, including Bitcoin (BTC) and Ethereum (ETH), to trade above $2.50 at the time of writing on Monday. Short-term technical analysis and the return of risk-off sentiment reinforce XRP’s short-term bullish outlook in the broader cryptocurrency market.
XRP fund inflows rise, supporting recovery
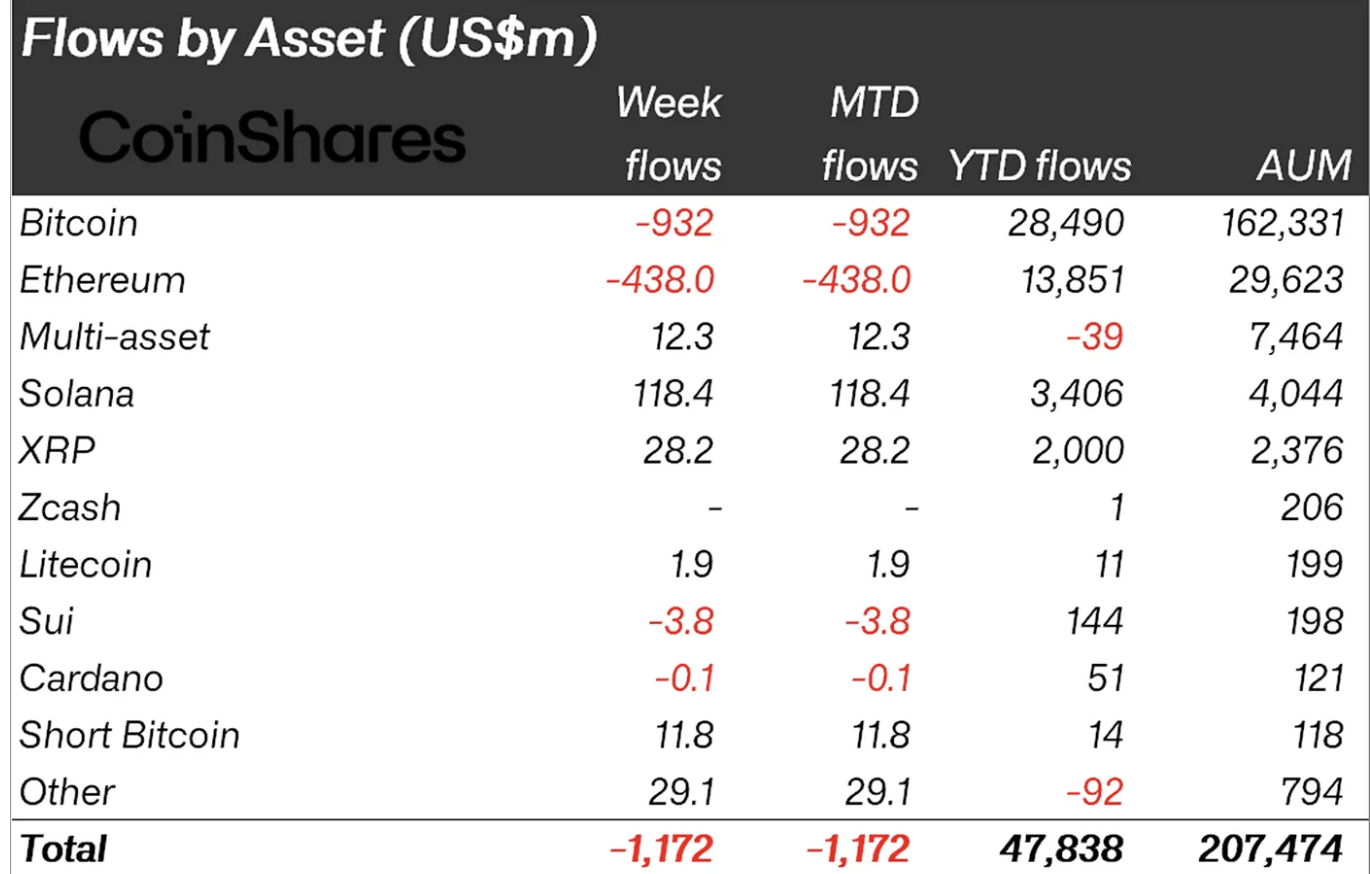
Digital asset investment products experienced outflows last week, except for a few select coins, such as XRP, which recorded inflows, defying risk-off sentiment. According to CoinShares, XRP’s weekly inflow volume averaged $28 million last week, bringing the total assets under management (AUM) to $2.4 billion.
In comparison, Bitcoin and Ethereum faced significant outflows of $932 million and $438 million, respectively. In total, digital asset investment products experienced outflows of $1.17 billion. CoinShares stated that the outflows were due to “post-liquidity cascade volatility and uncertainty over a potential United States (US) rate cut.”
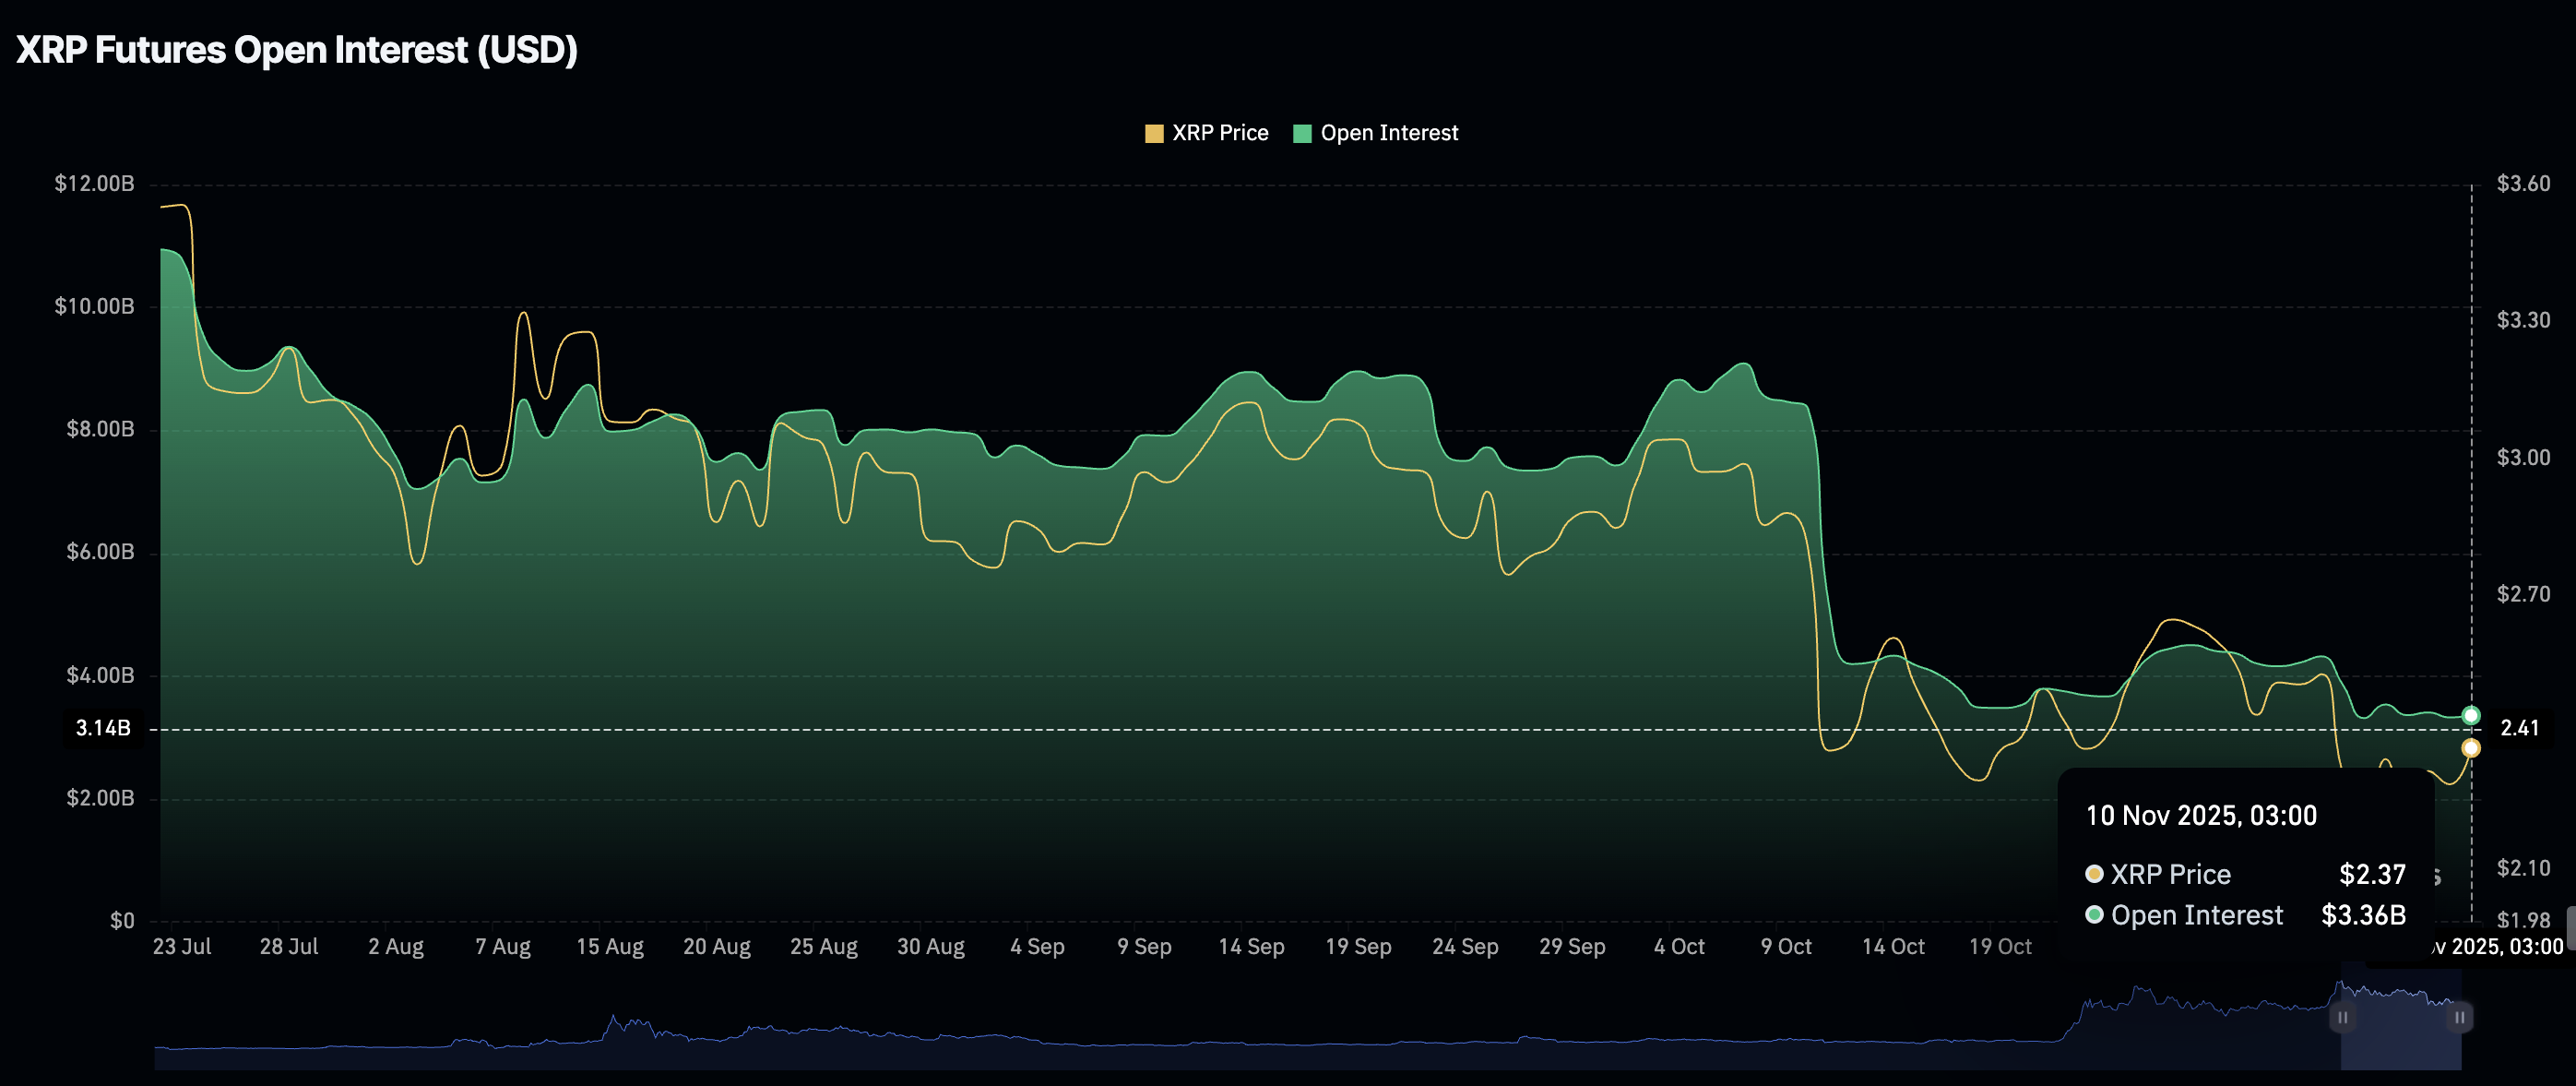
Meanwhile, retail demand for XRO remains relatively low, with the Open Interest (OI) averaging $3.36 billion on Monday compared to $4.17 billion on November 7 and $9 billion, the October peak level.
OI tracks the notional value of outstanding futures contracts, which can be used to gauge investor interest. To sustain the uptrend, more traders should increase their risk exposure. Otherwise, a suppressed OI suggests that traders are not convinced XRP can sustain the uptrend in the short to medium term.
Technical outlook: Evaluating XRP’s recovery potential
XRP is trading above $2.50 at the time of writing on Monday after its intraday uptrend was rejected at $2.57. The 200-period Exponential Moving Average (EMA) provides initial support at $2.49 on the 4-hour chart, which may come in handy if profit-taking continues to dampen recovery.
The Relative Strength Index (RSI) is at 68 on the same daily chart, down from slightly overbought conditions at 71. If the RSI declines further, it would indicate easing of bullish momentum.
Traders will watch for a daily close above the 50-day EMA to ascertain XRP’s bullish outlook, especially with the Moving Average Convergence Divergence (MACD) indicator upholding a buy signal on the daily chart since last Wednesday.
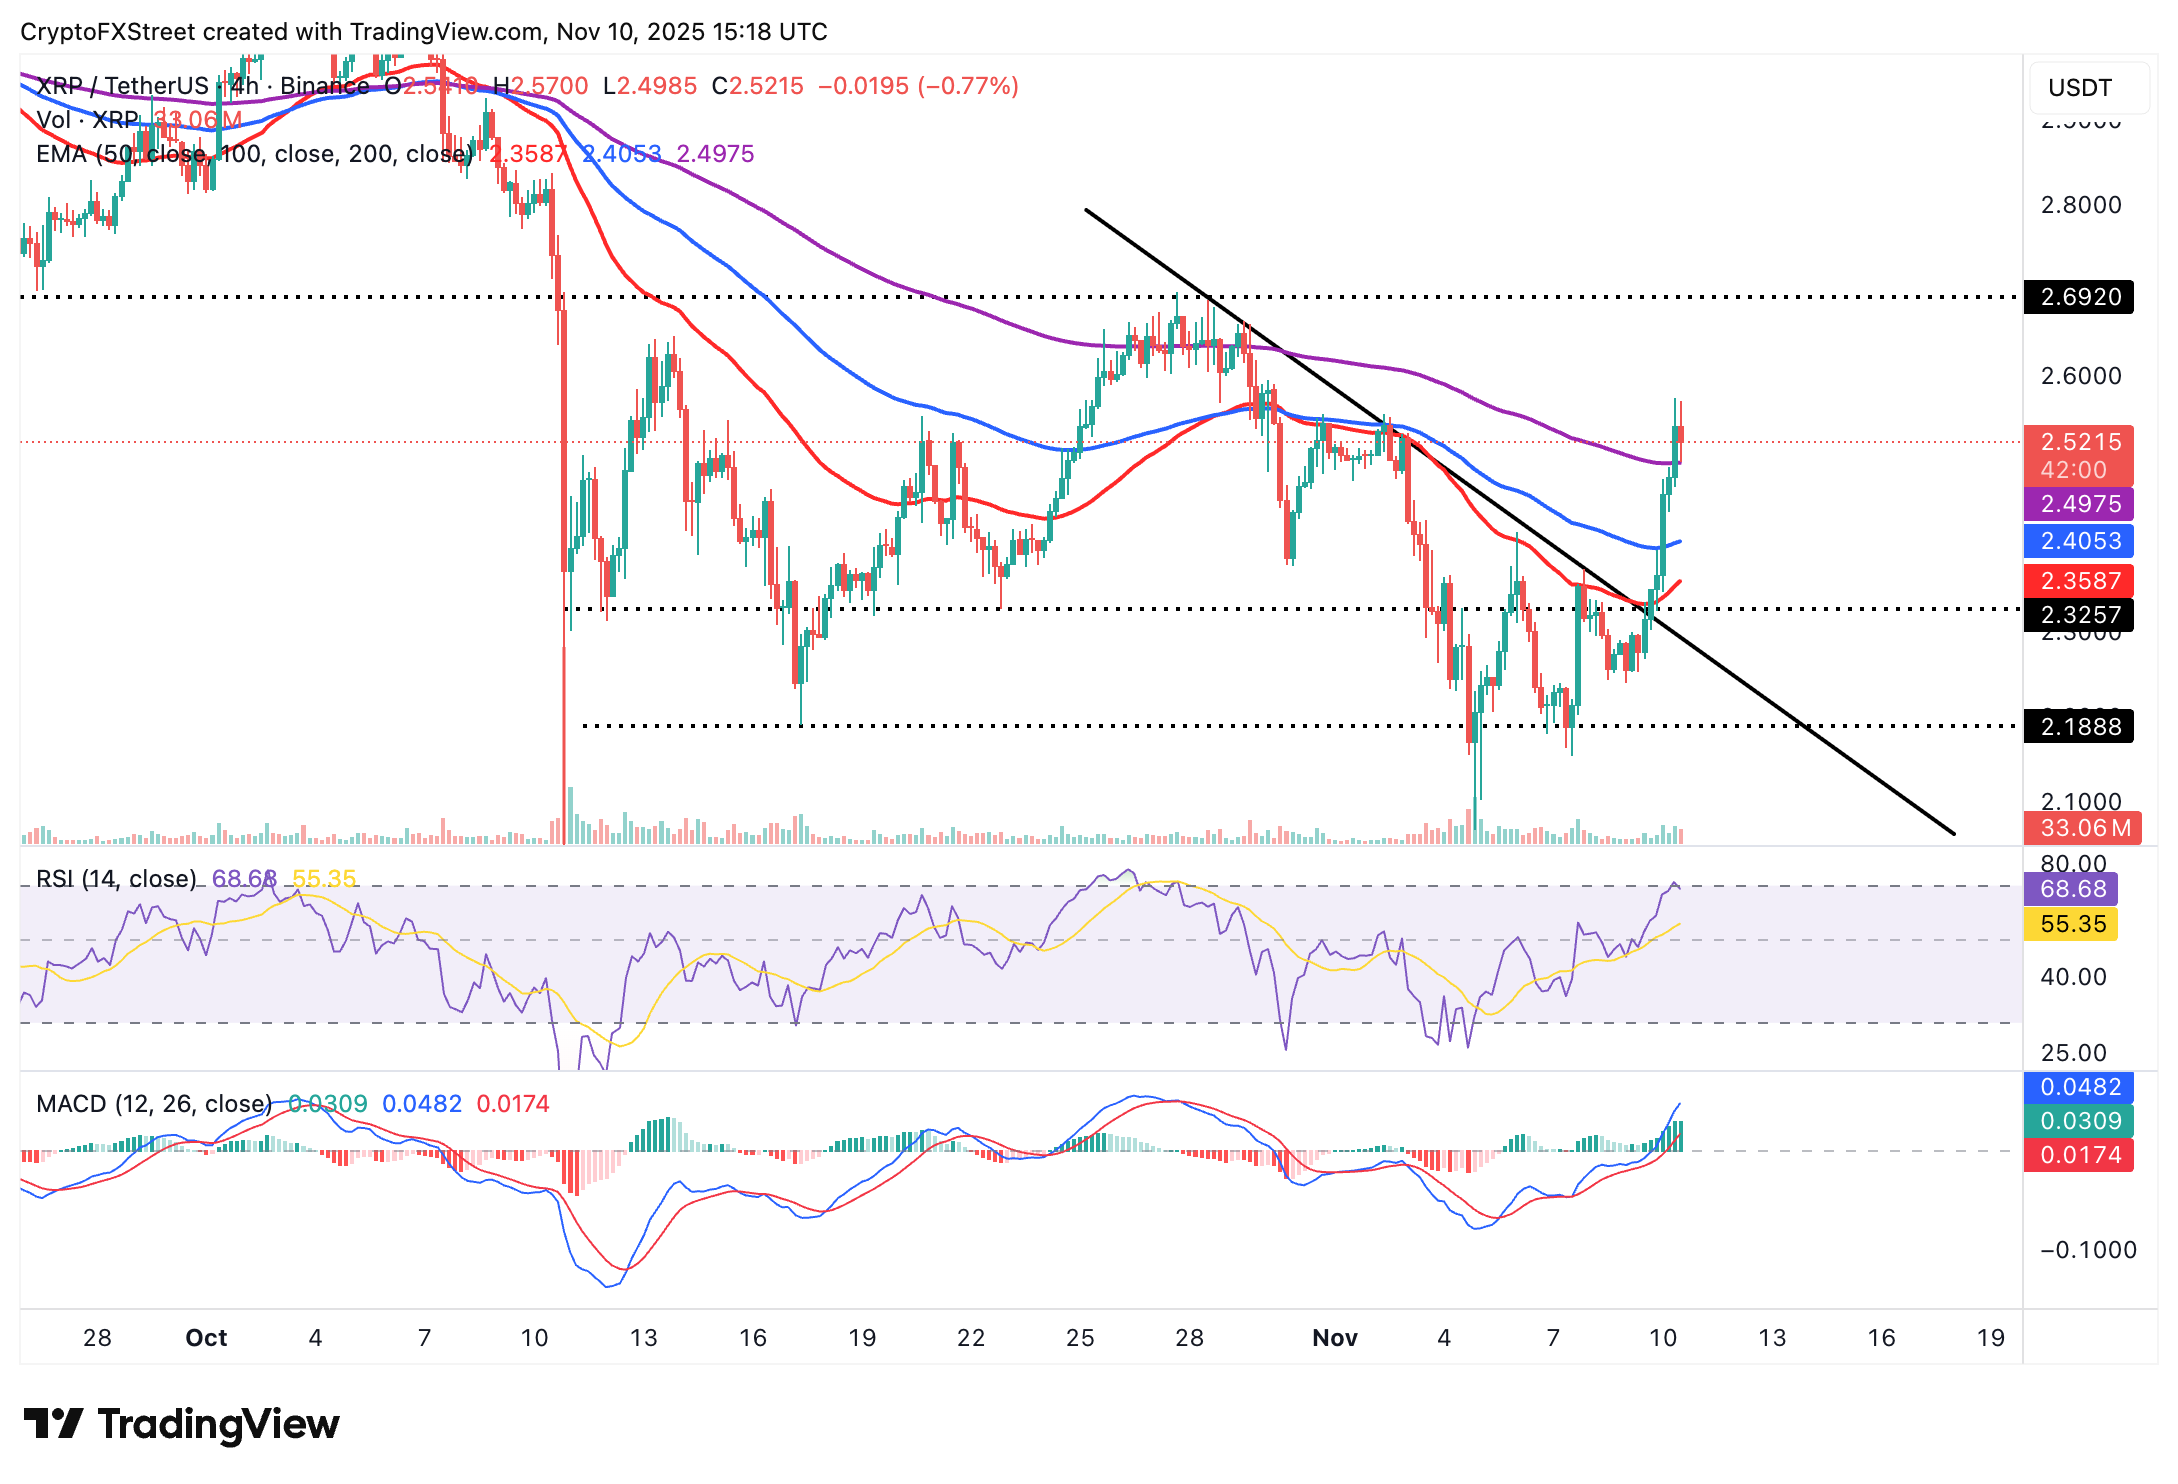
Still, if supply overwhelms demand due to low retail demand in the derivatives market and profit-taking in the spot market, XRP could extend the decline below the 200-period EMA toward the 100-period EMA at 2.40.
Cryptocurrency metrics FAQs
The developer or creator of each cryptocurrency decides on the total number of tokens that can be minted or issued. Only a certain number of these assets can be minted by mining, staking or other mechanisms. This is defined by the algorithm of the underlying blockchain technology. On the other hand, circulating supply can also be decreased via actions such as burning tokens, or mistakenly sending assets to addresses of other incompatible blockchains.
Market capitalization is the result of multiplying the circulating supply of a certain asset by the asset’s current market value.
Trading volume refers to the total number of tokens for a specific asset that has been transacted or exchanged between buyers and sellers within set trading hours, for example, 24 hours. It is used to gauge market sentiment, this metric combines all volumes on centralized exchanges and decentralized exchanges. Increasing trading volume often denotes the demand for a certain asset as more people are buying and selling the cryptocurrency.
Funding rates are a concept designed to encourage traders to take positions and ensure perpetual contract prices match spot markets. It defines a mechanism by exchanges to ensure that future prices and index prices periodic payments regularly converge. When the funding rate is positive, the price of the perpetual contract is higher than the mark price. This means traders who are bullish and have opened long positions pay traders who are in short positions. On the other hand, a negative funding rate means perpetual prices are below the mark price, and hence traders with short positions pay traders who have opened long positions.
Author

John Isige
FXStreet
John Isige is a seasoned cryptocurrency journalist and markets analyst committed to delivering high-quality, actionable insights tailored to traders, investors, and crypto enthusiasts. He enjoys deep dives into emerging Web3 tren



