Two bullish signals hint at XRP price short-term price rally
- XRP returns above $3.00, marking a significant step toward the $3.66 record high.
- XRP futures Open Interest nears the $8 billion mark as retail interest grows.
- XRP futures weighted funding rate remains steady near 0.0103% as traders pile into long positions.

Ripple (XRP) bulls are teasing a breakout above the critical $3.00 level on Wednesday, as Bitcoin (BTC) leads the crypto market in a mid-week recovery. Interest in the cross-border money remittance token has been rising this week, following an extended risk-off period that saw XRP’s derivatives market wobble.
A daily close above the $3.00 level is anticipated, which would affirm the short-term bullish outlook and target the hurdle at $3.35.
Traders generally expect the United States (US) Federal Reserve (Fed) to cut interest rates on September 17, following a series of weak economic data, including the Nonfarm Payrolls benchmark revision, which suggests that the US has been grappling with a weakening labor market, stressing the need for rate cuts heading into the fourth quarter.
XRP builds bullish momentum as retail demand swells
The uptick in XRP price is in tandem with the steady increase in the futures Open Interest (OI). CoinGlass data shows that OI, referring to the notional value of outstanding futures contracts, is approaching the $8 billion mark, up from $7.37 billion posted on Sunday.
As the OI increases, XRP price gains bullish momentum, underpinning investor confidence in the uptrend. Similarly, a higher OI reading as volume rises implies heightened trading activity.
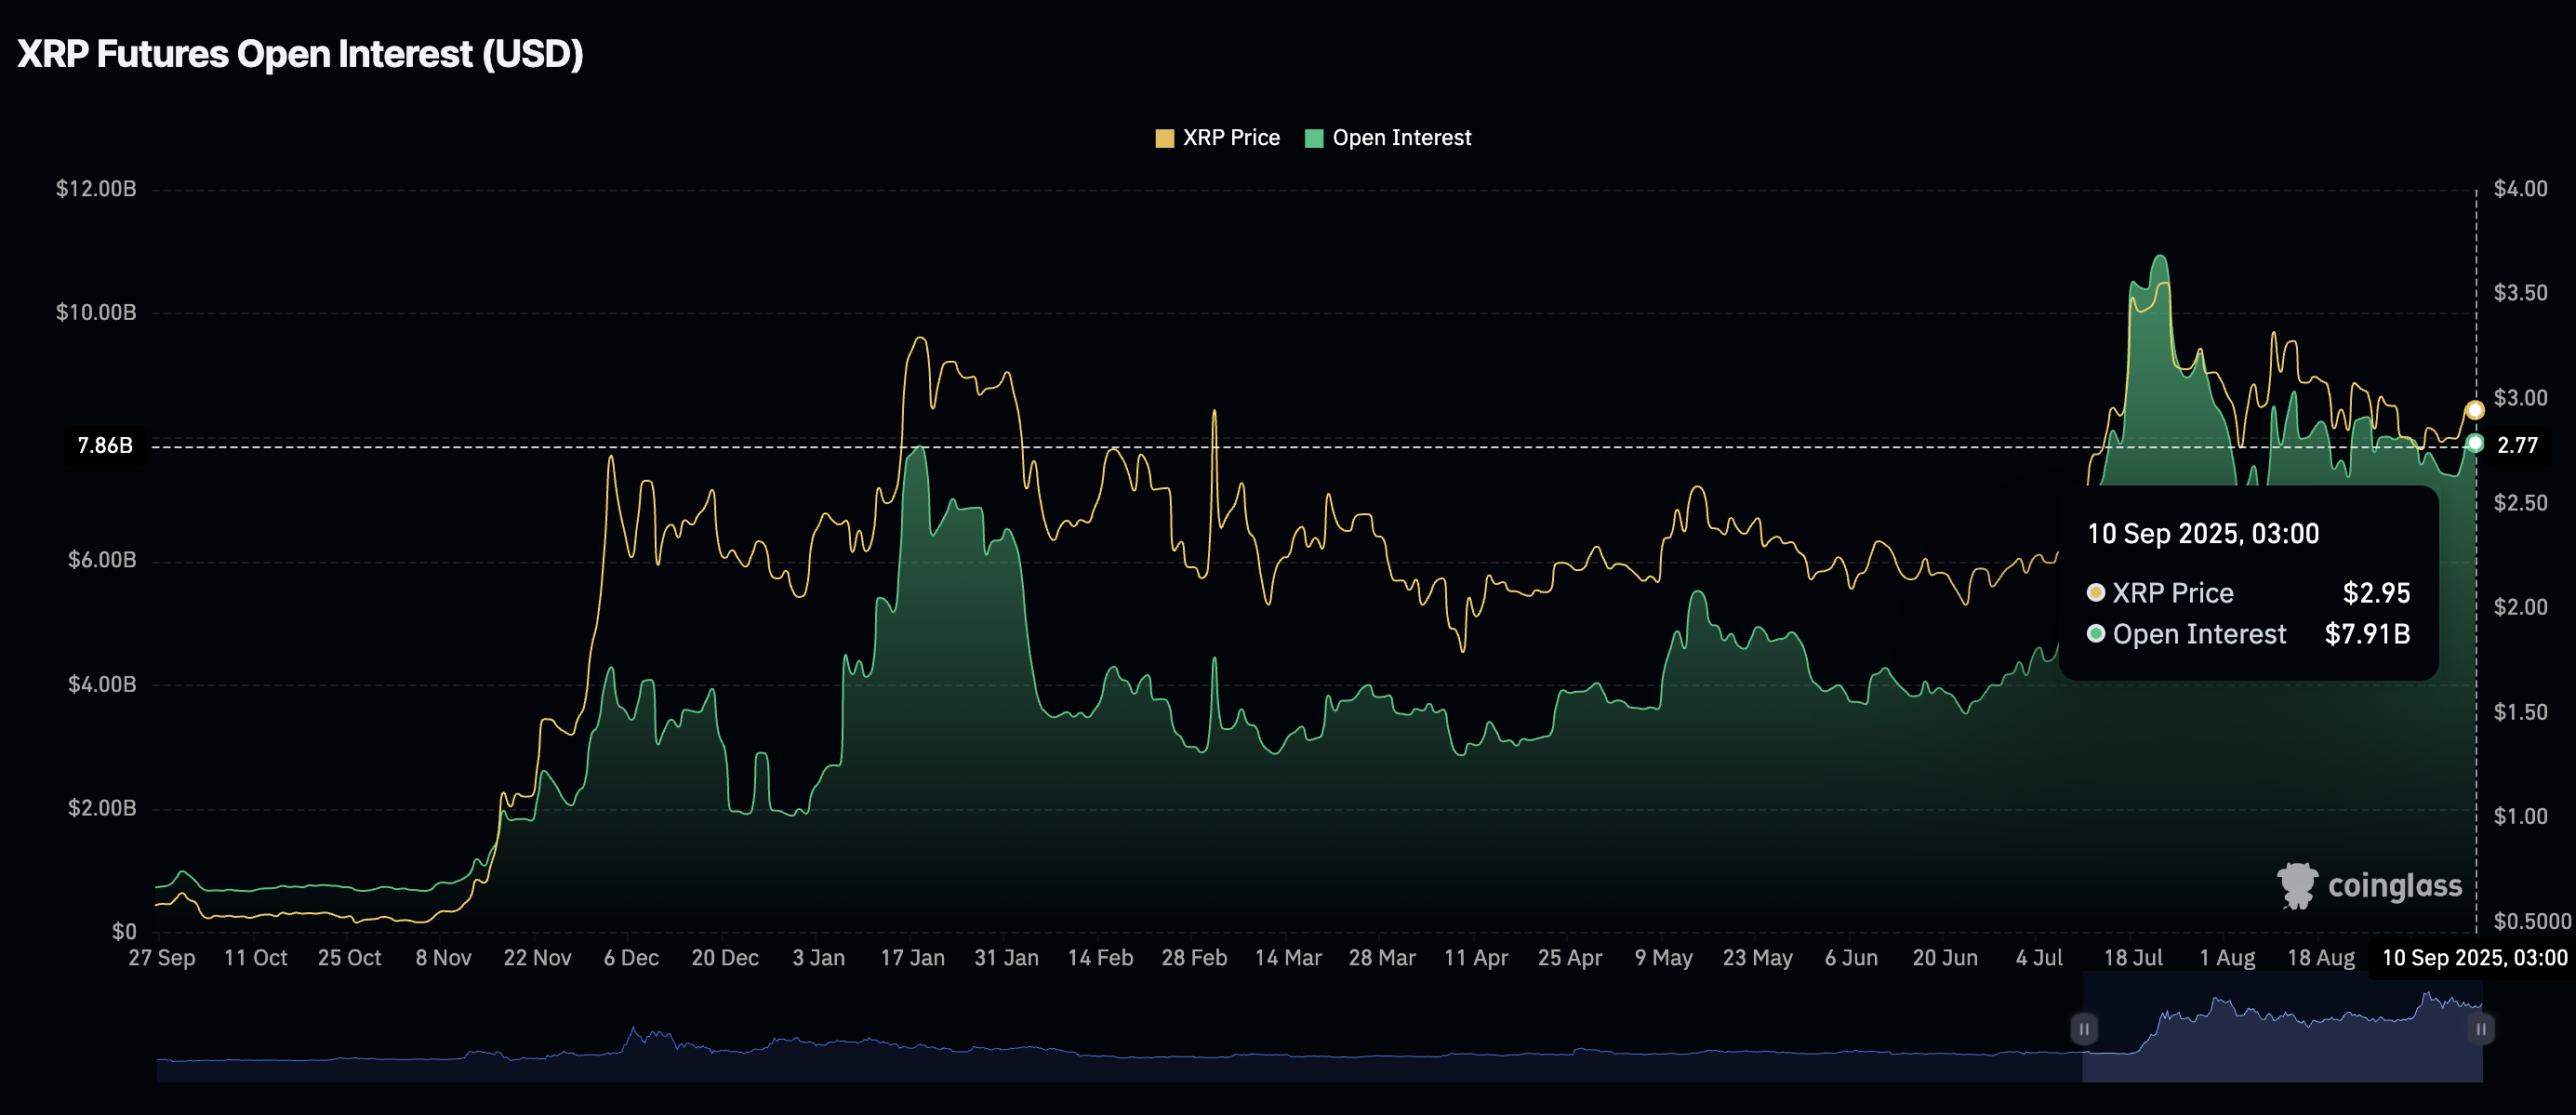
XRP Futures Open Interest | Source: CoinGlass
A steady weighted funding rate of 0.0103%, as shown in the chart below, supports the positive sentiment surrounding XRP. This implies that traders are piling into long positions, expecting the rebound above $3.00 to continue in the short term.
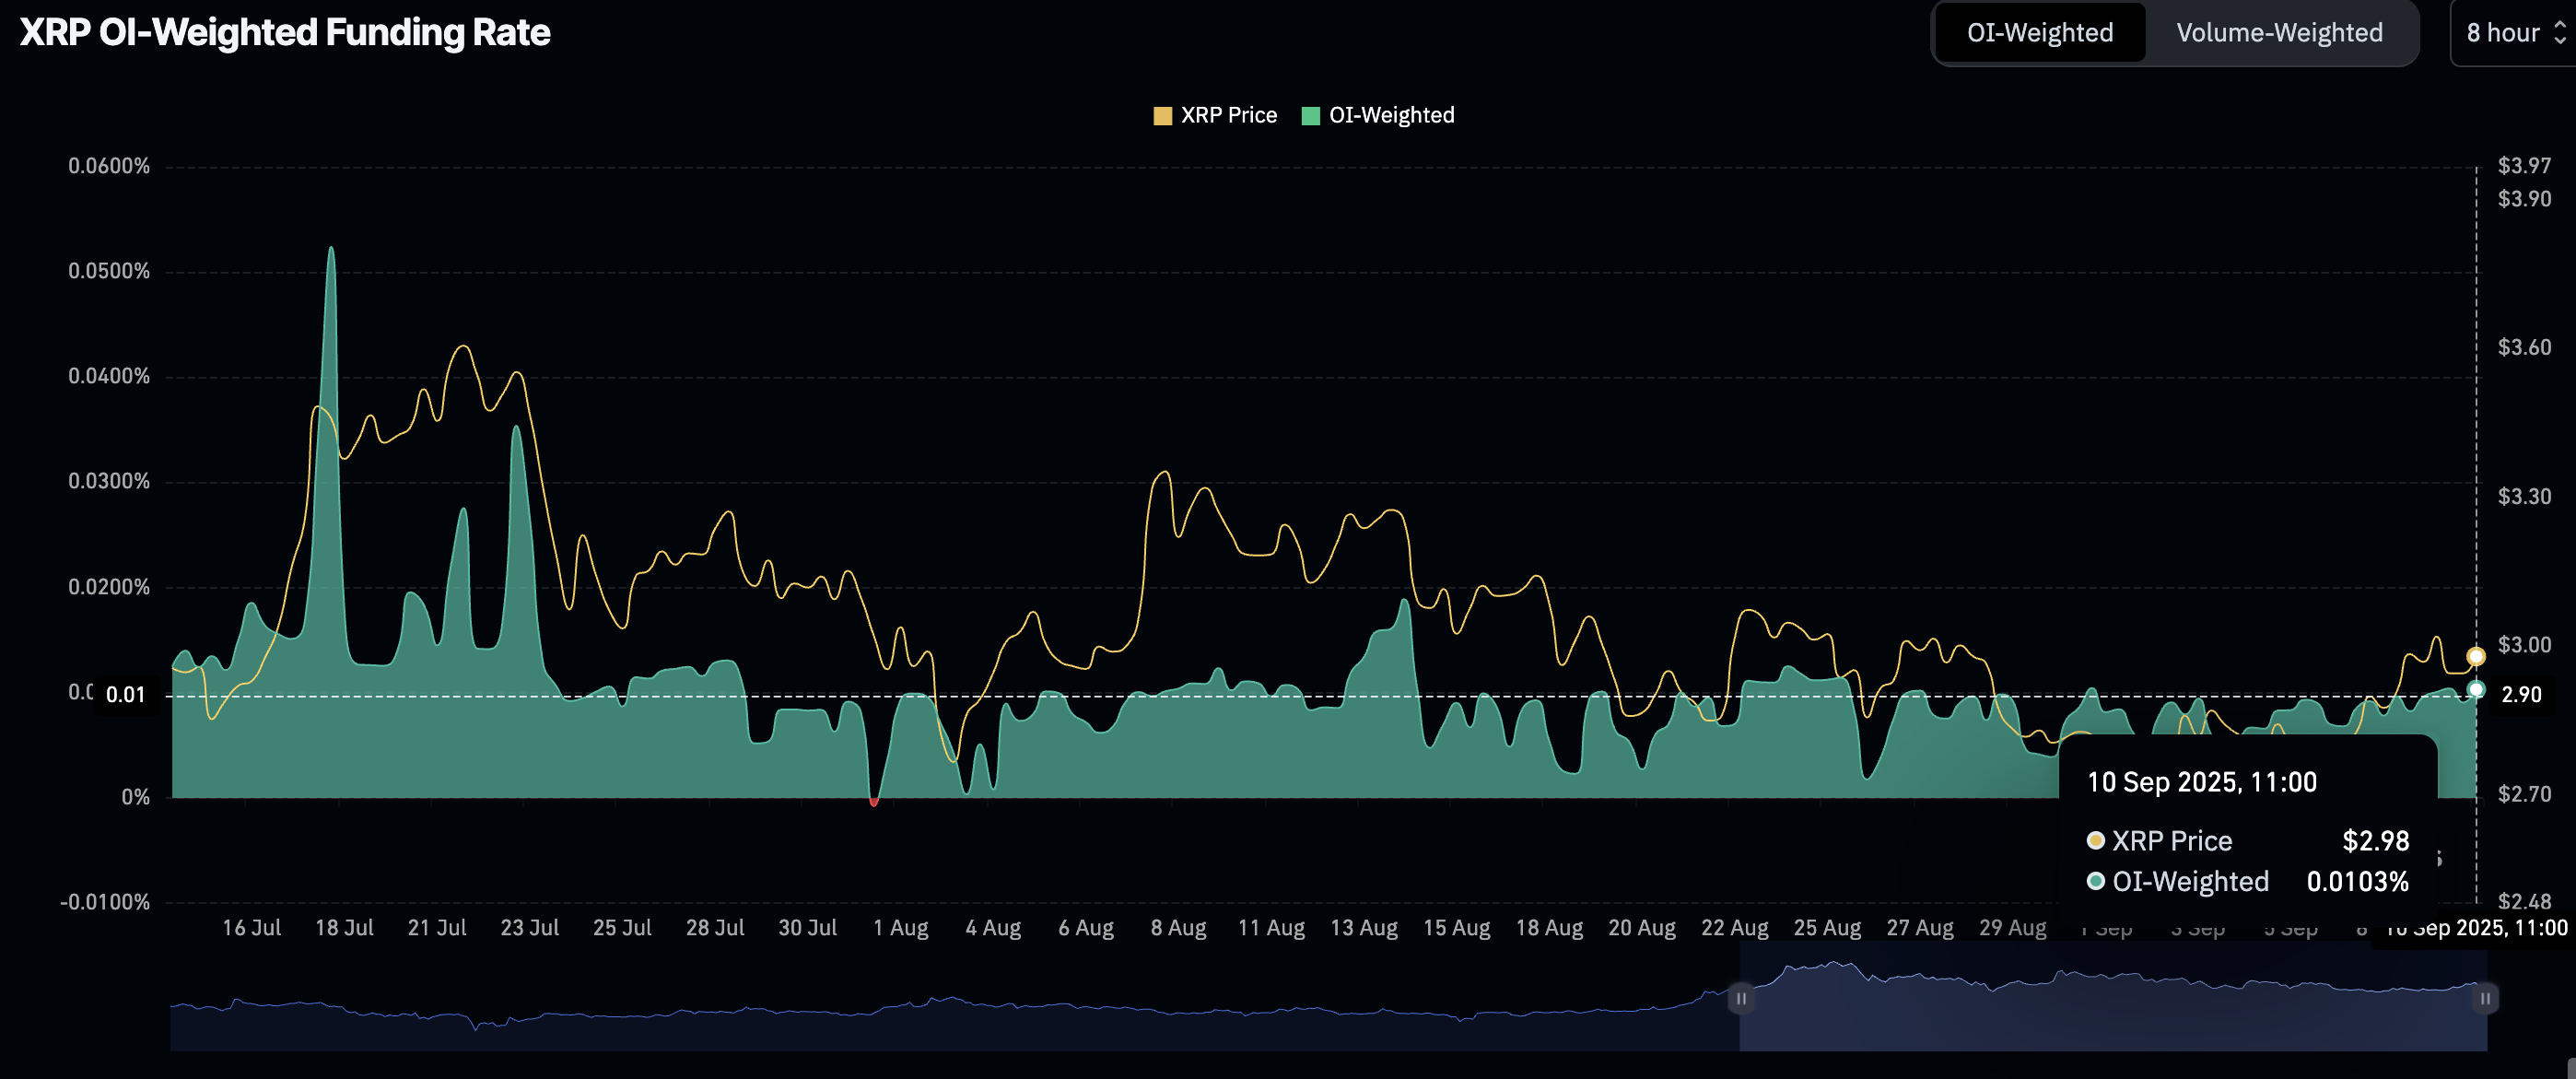
XRP Futures Weighted Funding Rate | Source: CoinGlass
Technical outlook: XRP bulls set eyes on record high
XRP holds above several key levels, including the resistance-turned-support at $3.00, a descending trendline and the 50-day Exponential Moving Average (EMA) at $2.91 on the daily chart.
The Moving Average Convergence Divergence (MACD) indicator reinforces the short-term bullish outlook, sustaining a buy signal triggered on Monday. Investors will likely continue to seek exposure as long as the blue MACD line holds above the orange signal line.
Based on the Relative Strength Index (RSI), positioned at 55, bearish momentum is gradually fading, paving the way for bulls to regain control of the trend. Higher RSI readings, approaching overbought territory, would underpin the steady increase in buying pressure backing retail demand for XRP.
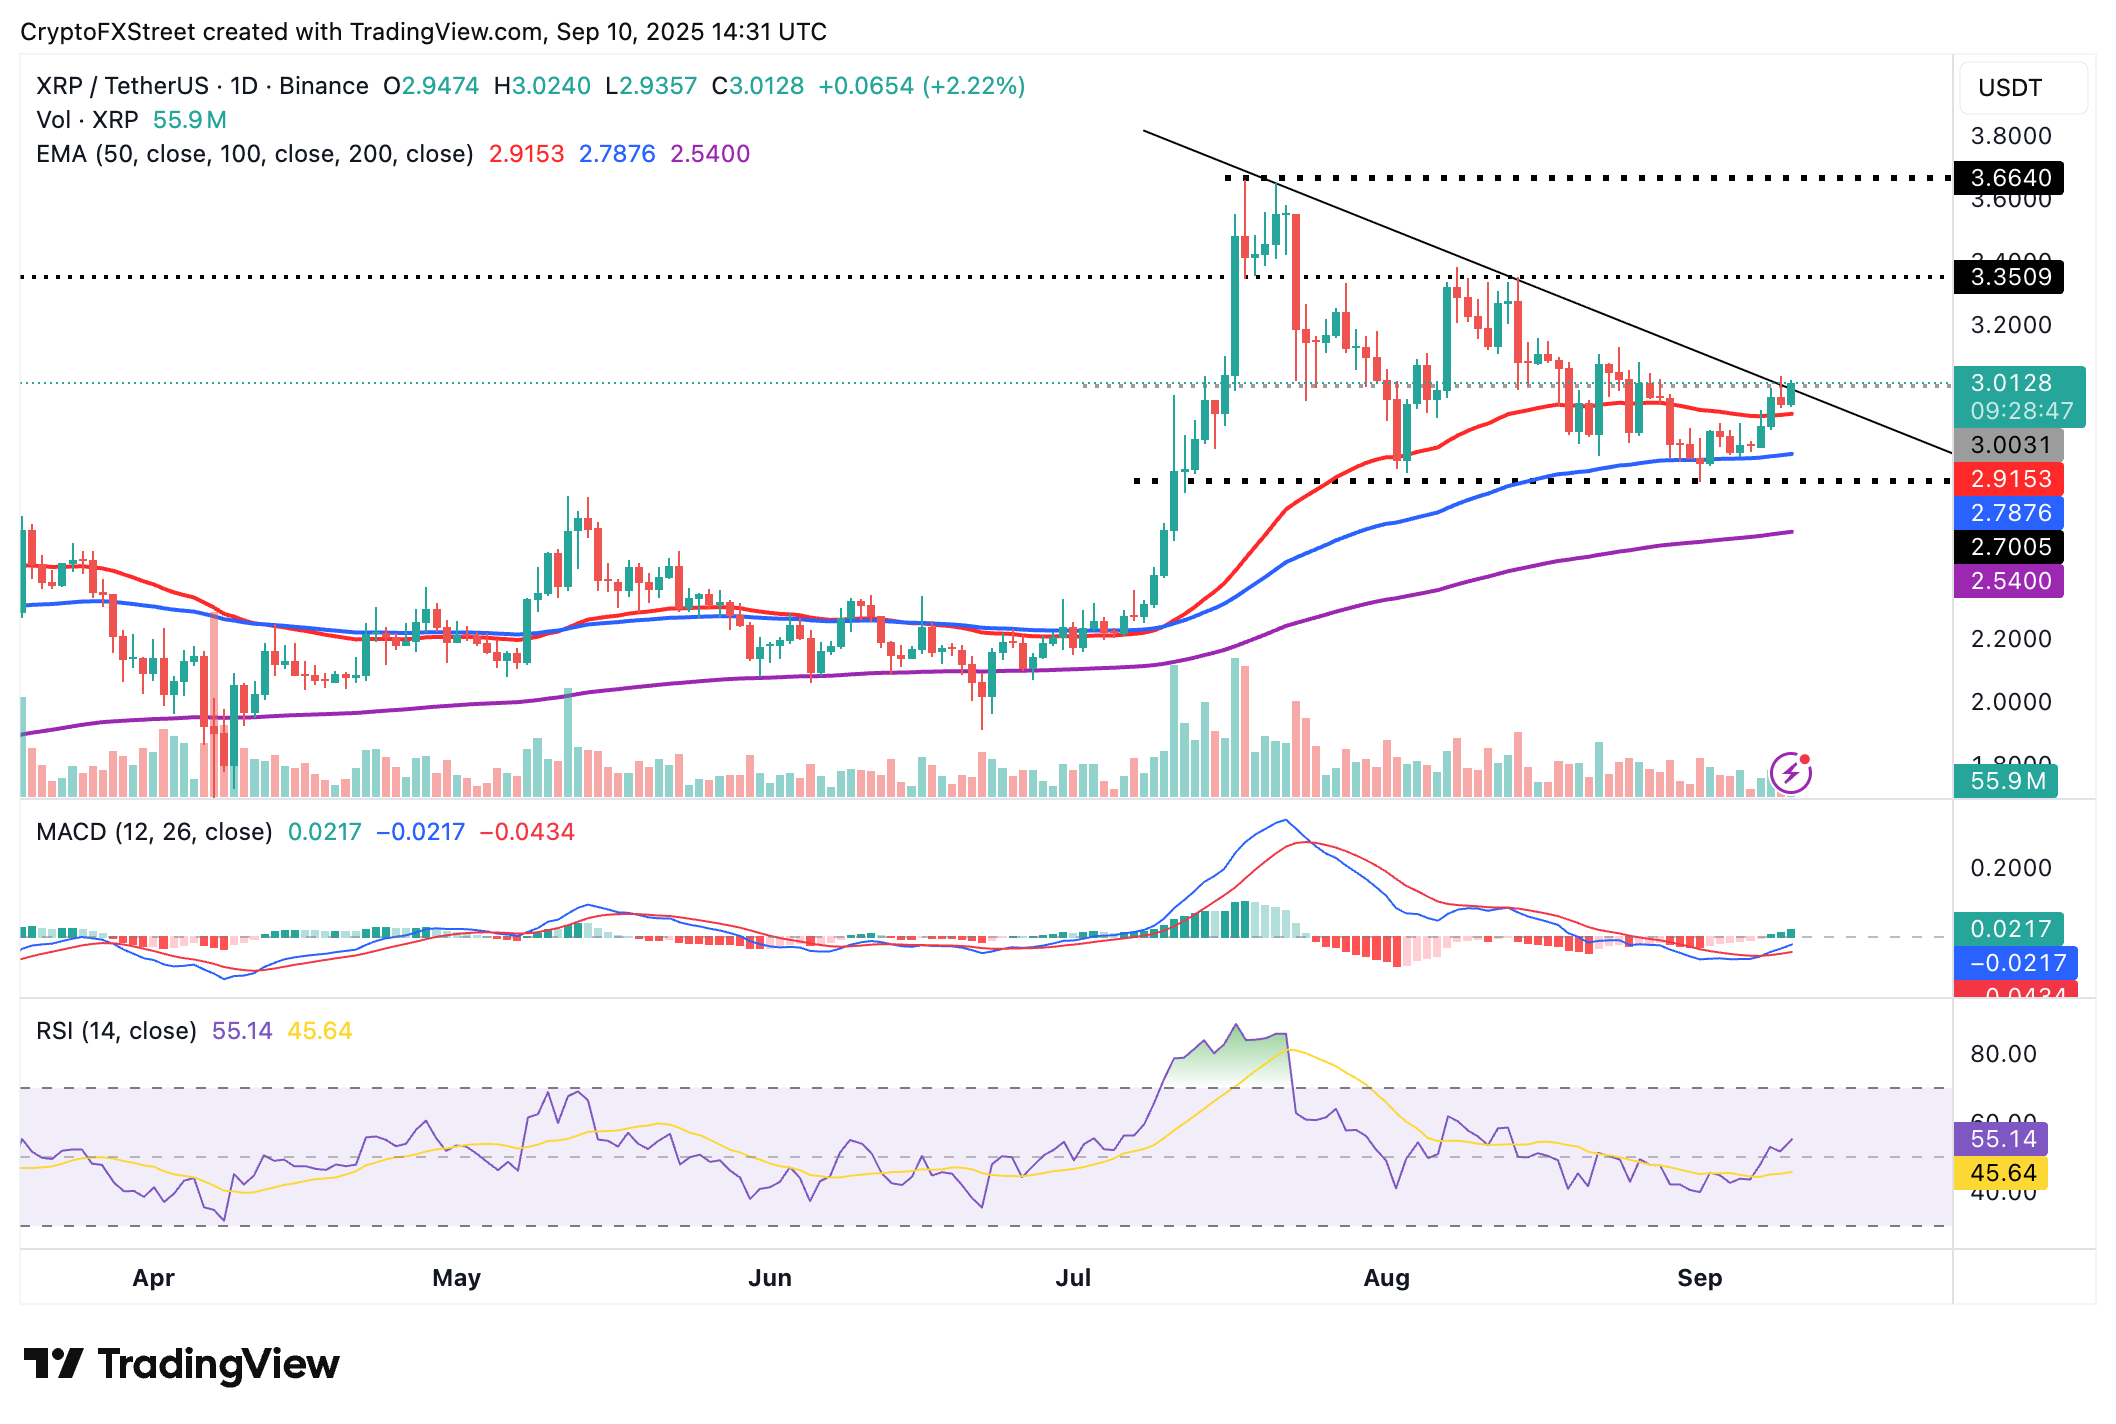
XRP/USDT daily chart
Still, traders should be cautious and watch out for sustained pullbacks below the 50-day EMA support at $2.91. The 100-day EMA at $2.78 and the 200-day EMA at $2.53 would serve as tentative support levels in that case. Profit-taking amid changing market dynamics could result in risk-off sentiment overwhelming buying pressure.
Cryptocurrency metrics FAQs
The developer or creator of each cryptocurrency decides on the total number of tokens that can be minted or issued. Only a certain number of these assets can be minted by mining, staking or other mechanisms. This is defined by the algorithm of the underlying blockchain technology. On the other hand, circulating supply can also be decreased via actions such as burning tokens, or mistakenly sending assets to addresses of other incompatible blockchains.
Market capitalization is the result of multiplying the circulating supply of a certain asset by the asset’s current market value.
Trading volume refers to the total number of tokens for a specific asset that has been transacted or exchanged between buyers and sellers within set trading hours, for example, 24 hours. It is used to gauge market sentiment, this metric combines all volumes on centralized exchanges and decentralized exchanges. Increasing trading volume often denotes the demand for a certain asset as more people are buying and selling the cryptocurrency.
Funding rates are a concept designed to encourage traders to take positions and ensure perpetual contract prices match spot markets. It defines a mechanism by exchanges to ensure that future prices and index prices periodic payments regularly converge. When the funding rate is positive, the price of the perpetual contract is higher than the mark price. This means traders who are bullish and have opened long positions pay traders who are in short positions. On the other hand, a negative funding rate means perpetual prices are below the mark price, and hence traders with short positions pay traders who have opened long positions.
Author

John Isige
FXStreet
John Isige is a seasoned cryptocurrency journalist and markets analyst committed to delivering high-quality, actionable insights tailored to traders, investors, and crypto enthusiasts. He enjoys deep dives into emerging Web3 tren


