Crypto Today: Bitcoin reclaims $112,000, Ethereum and XRP eye mid-week rebound
- Bitcoin rises above $112,000 as the broader crypto market middle recovers.
- Ethereum extends sideways trading above key support as ETH ETFs break six-day outflow streak.
- XRP is on the verge of a technical breakout, eyeing $3.35 in the short-term and the $3.66 record high in the medium-term.

Bitcoin (BTC) rises above $112,000 on Wednesday, reflecting a buoyant mood following a sharp retracement the previous day. The largest digital asset by market capitalization tested support at $110,803 on Tuesday, before resuming its recovery.
A breakout and a daily close above the short-term round-figure resistance at $113,000 is required to affirm the bullish grip.
Meanwhile, altcoins, including Ethereum (ETH) and Ripple (XRP), hold above key support levels, indicating potential for a sustainable rebound toward the weekend.
Data spotlight: Ethereum ETFs resume inflows
Institutional interest in Ethereum signals a potential comeback, evidenced by the $44 million in inflows into ETH spot Exchange-Traded Funds (ETFs) on Tuesday. A sticky risk-off sentiment had seen institutional investors stay on the sidelines, extending outflows for six consecutive days.
Although none of the nine ETH spot ETFs operating in the United States (US) experienced outflows on Tuesday, BlackRock’s ETHA accounted for all the inflows.
Ethereum ETFs have a cumulative $12.67 billion in net inflow volume and $27.39 billion in total net assets.
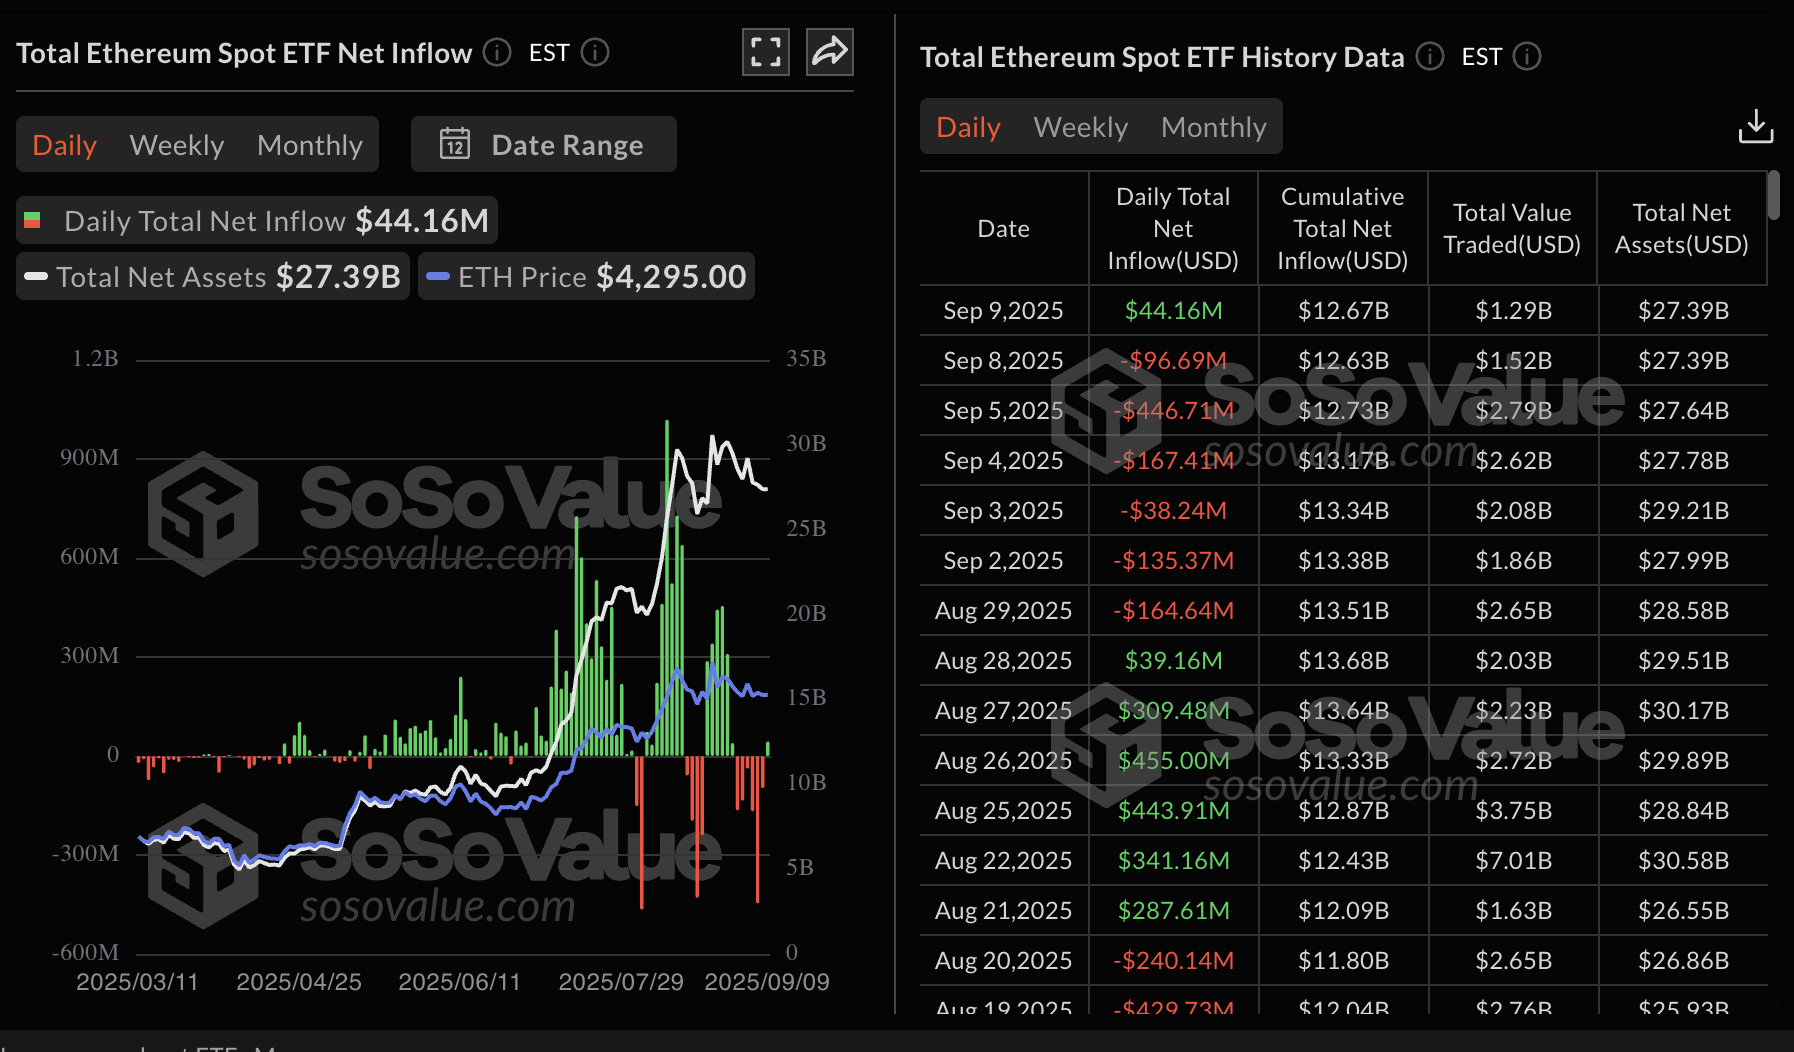
Ethereum ETF stats | Source: SoSoValue
Bitcoin ETFs are on the second day of inflows after breaking a two-day outflow streak on Monday. BTC spot ETFs in the US saw $23 million in inflows on Tuesday and $368 million on Monday, bringing the total net inflow to $54.88 billion and the cumulative net assets to $144.3 billion.
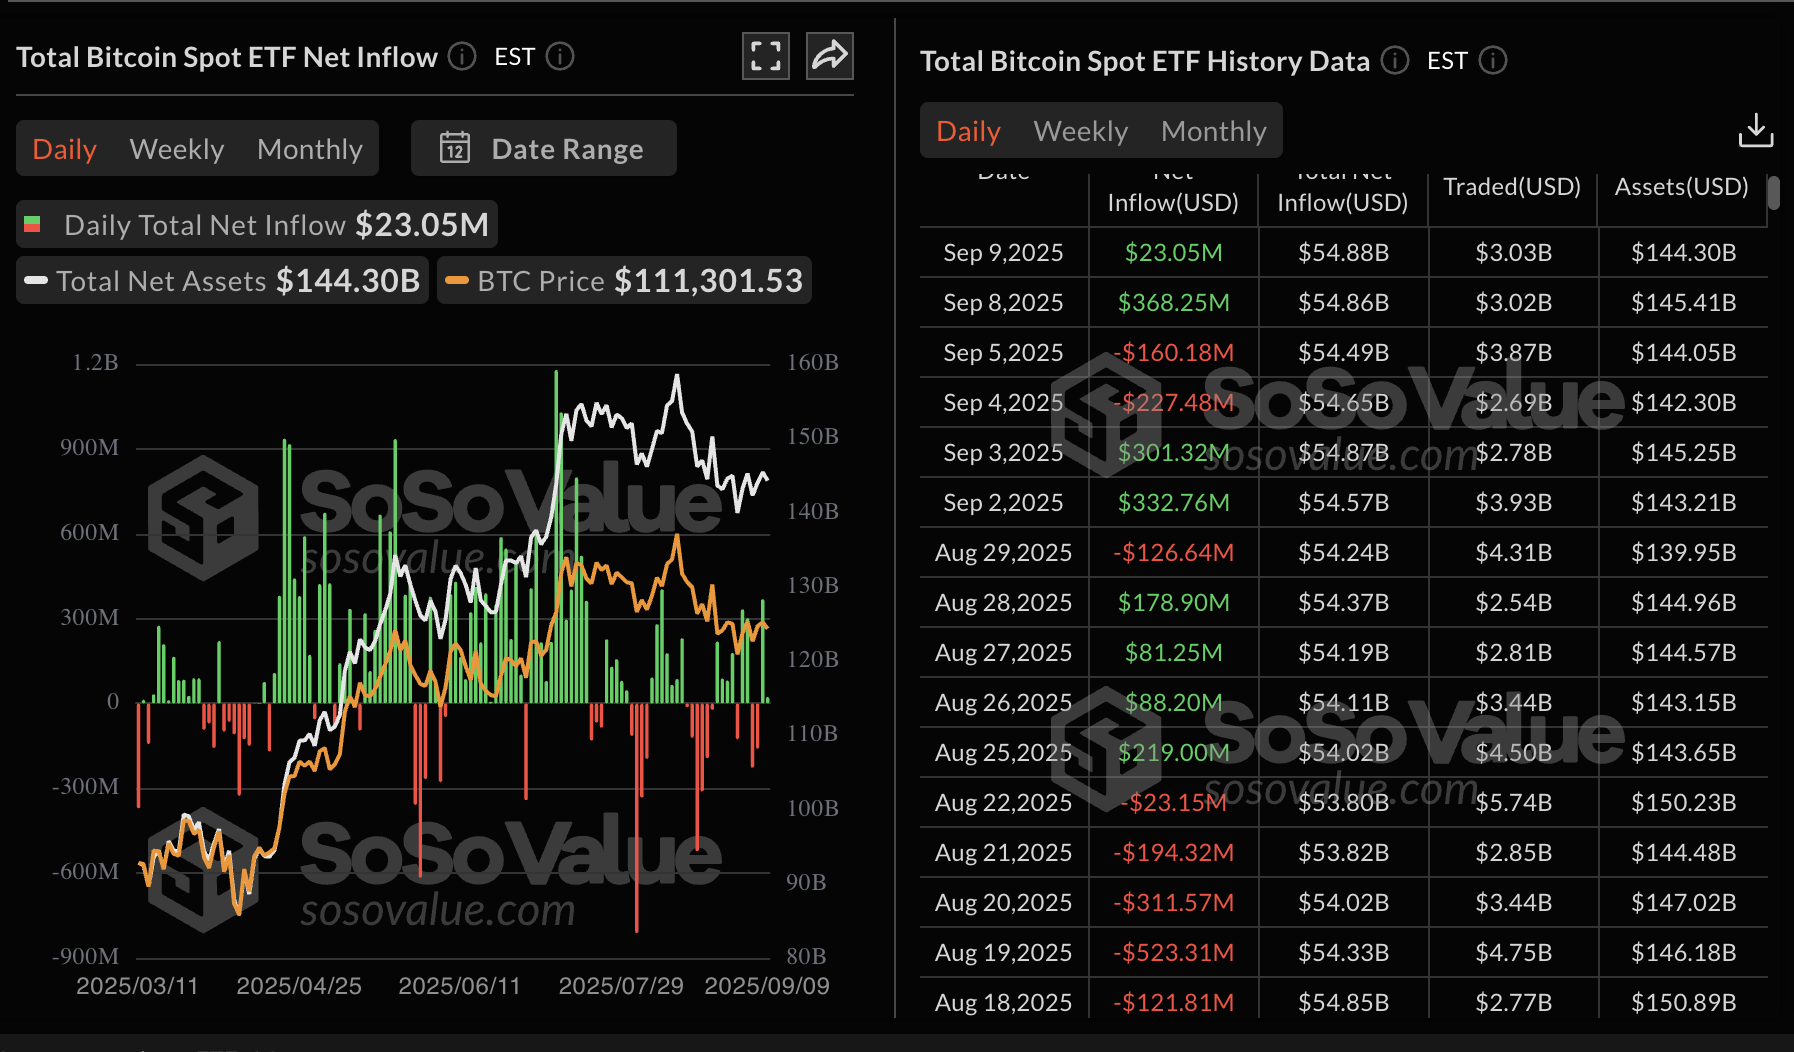
Bitcoin ETF stats | Source: SoSoValue
Meanwhile, retail interest in XRP is gaining momentum, supported by a steady increase in the futures Open Interest (OI), which averaged at $7.91 billion on Wednesday, up from $7.37 billion on Sunday. This rising trend suggests that investors have a strong conviction in XRP’s ability to sustain its recovery to the record high of $3.66 reached on July 18.
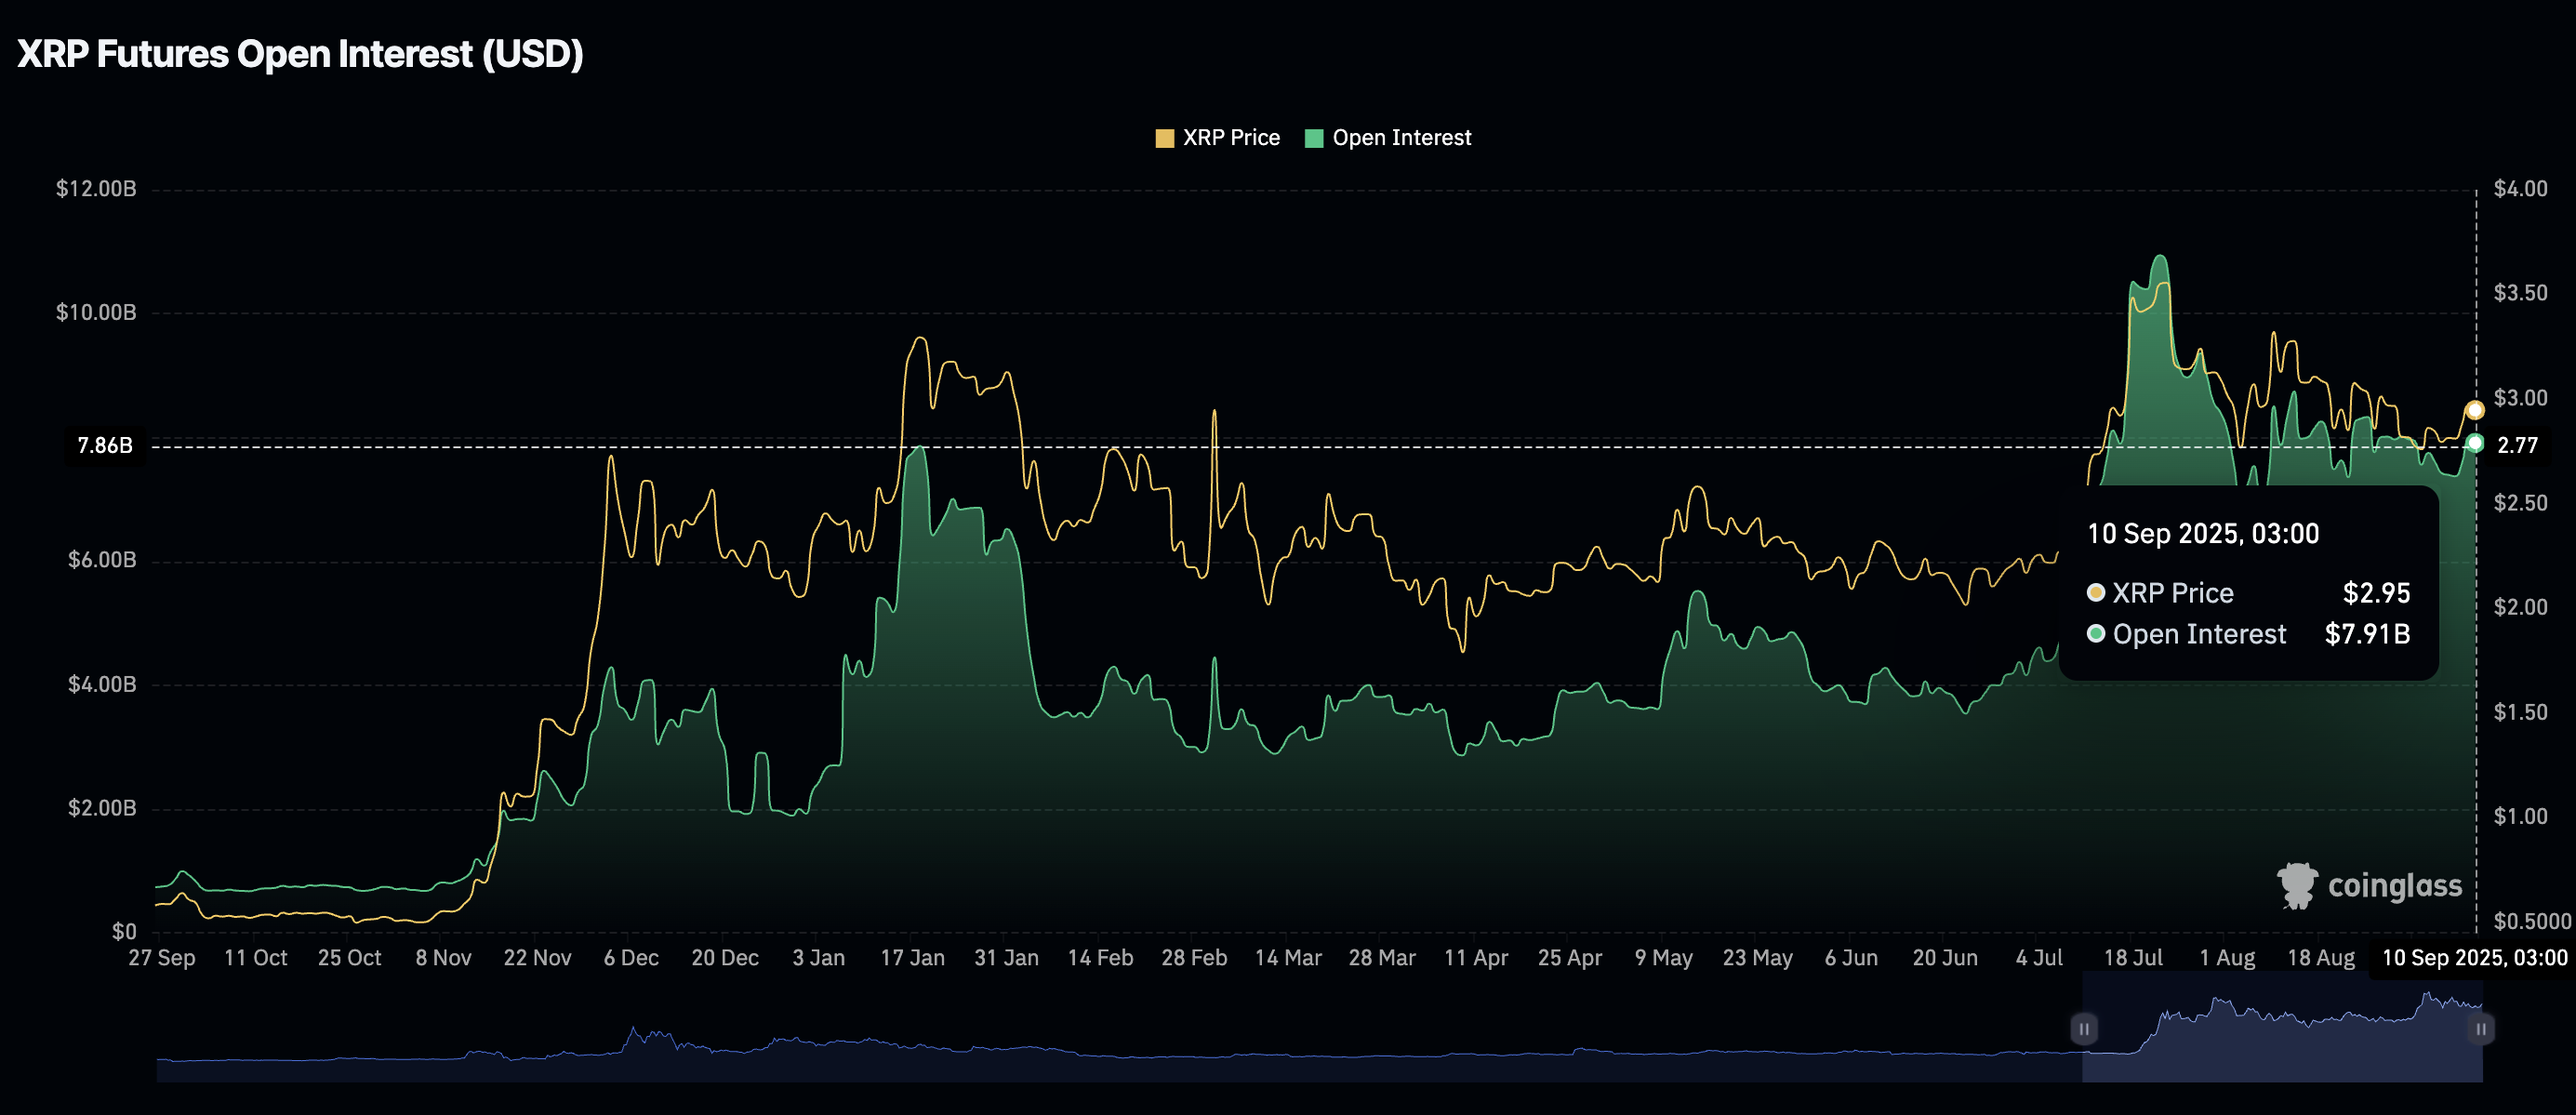
XRP Futures Open Interest | Source: CoinGlass
Chart of the day: Bitcoin eyes $120,000 breakout
Bitcoin price holds above the $112,000 level, buoyed by growing retail interest and optimism that the Federal Reserve (Fed) will cut interest rates on September 17. Key economic data, including the US Nonfarm Payrolls benchmark revision, suggest that the US has been grappling with a weakening labor market, stressing the need for rate cuts heading into the fourth quarter.
A strong technical structure supports the bullish outlook on the daily chart, starting with a buy signal from the Moving Average Convergence Divergence (MACD) indicator, which has been maintained since Sunday.
The Relative Strength Index (RSI) has recovered to 49 after falling to 38 on August 30, underscoring the bullish outlook highlighted by the MACD indicator. A higher RSI reading would imply that bearish momentum is fading as bulls regain control, affirming the impending breakout toward the $120,000 target.
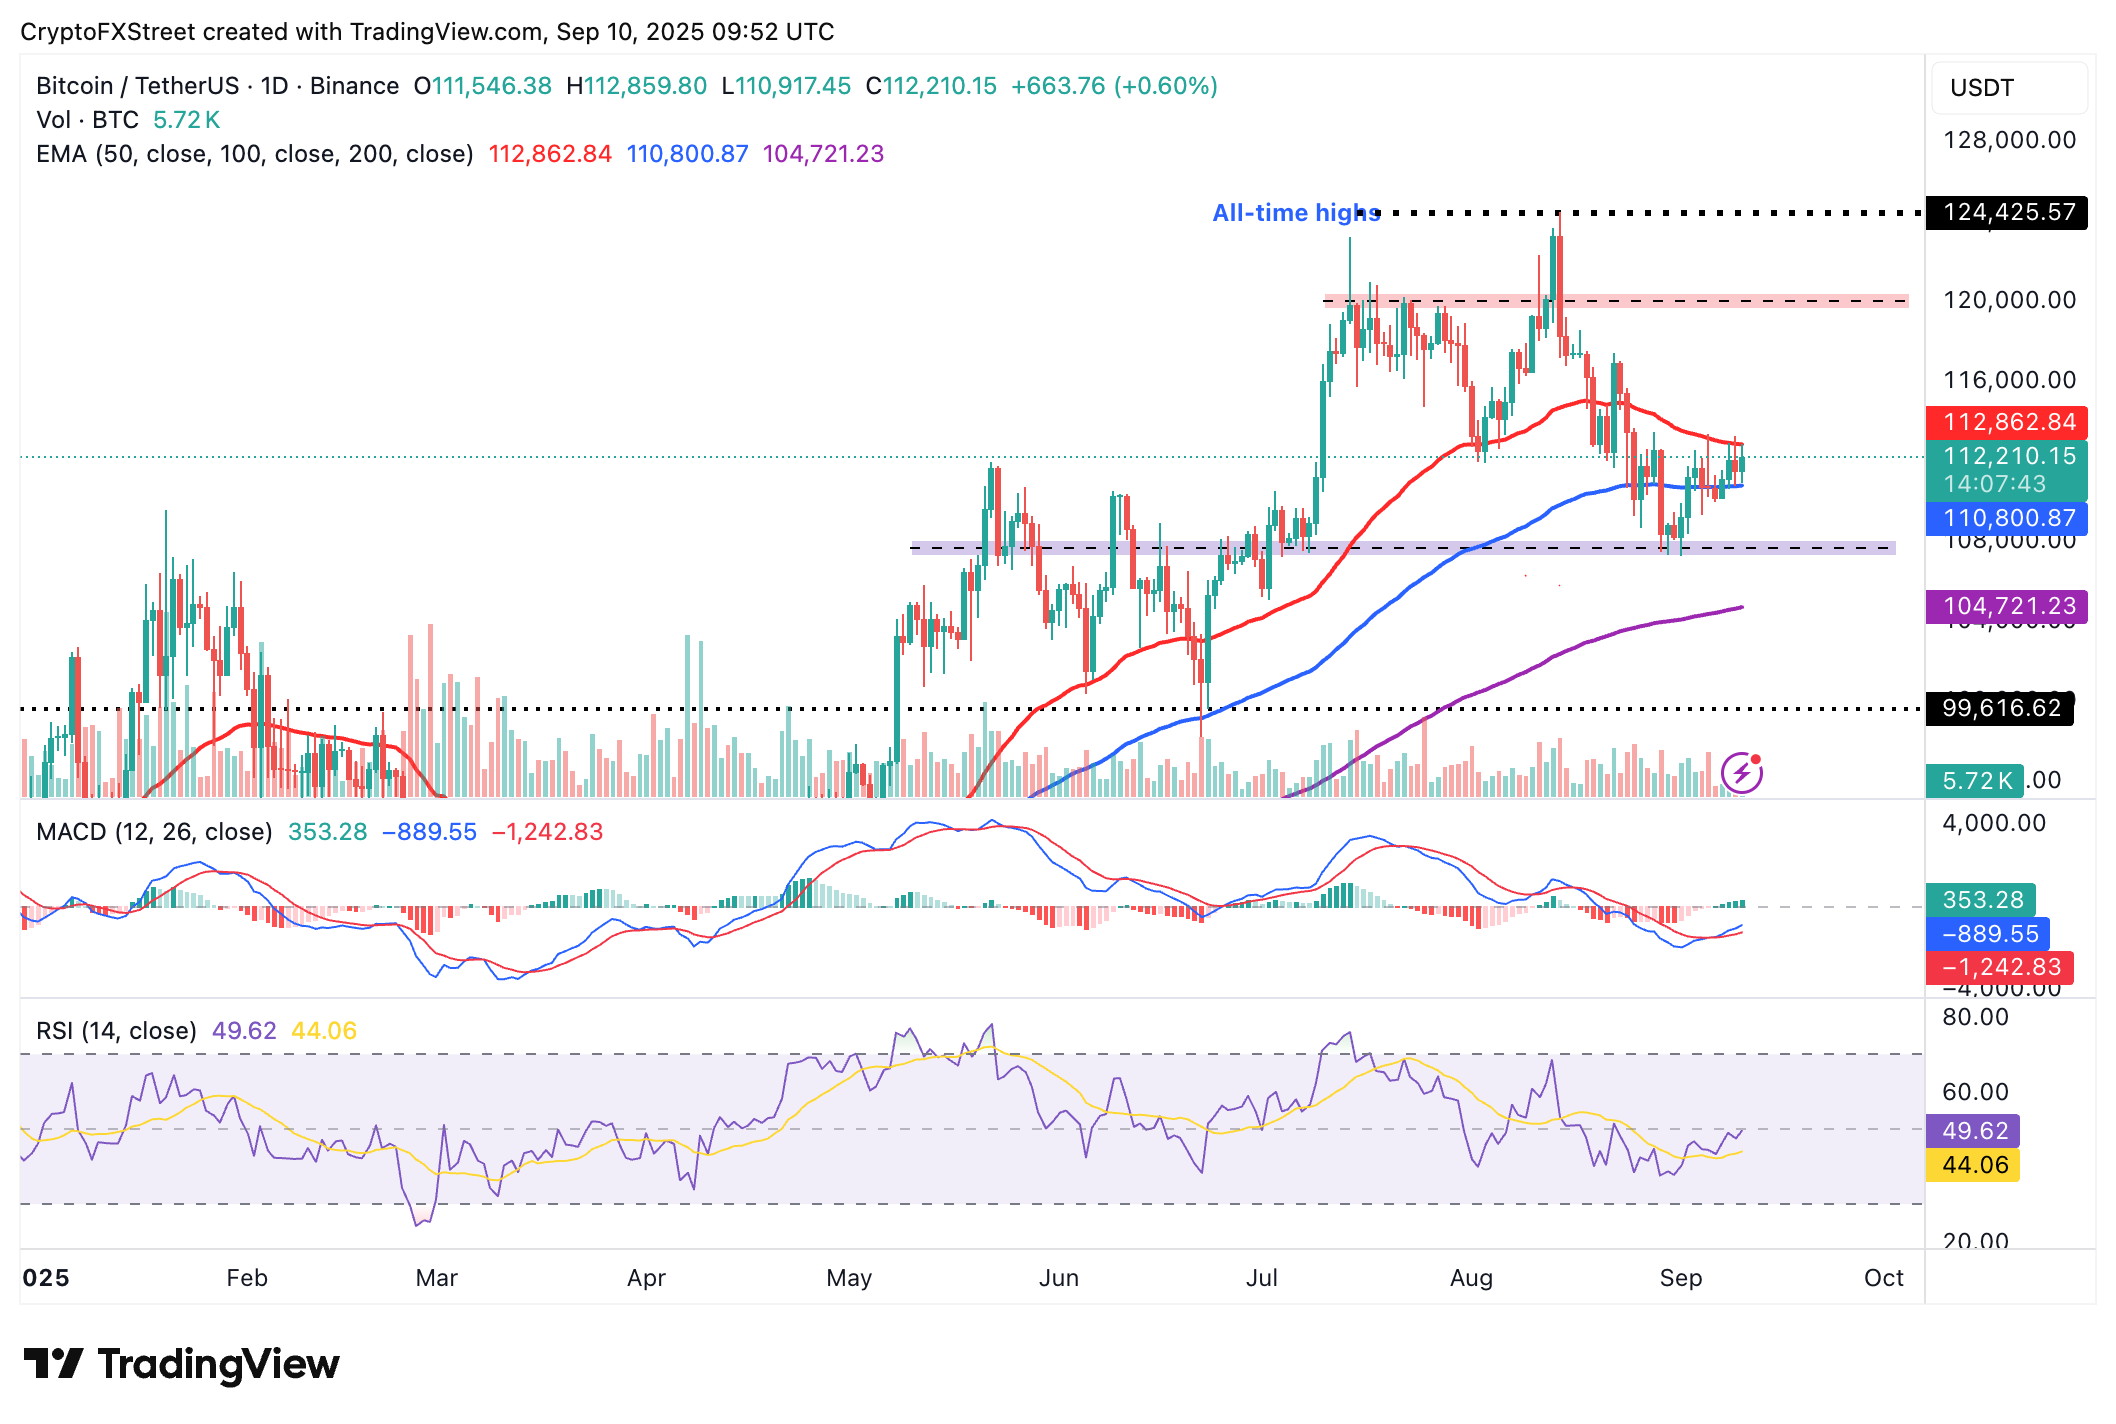
BTC/USDT daily chart
Altcoins update: Ethereum consolidates as XRP seeks breakout
Ethereum holds above support provided by the 50-day Exponential Moving Average (EMA) at $4,096, but remains significantly below its record high of $4,956 reached on August 24.
Technical indicators back the prevailing sideways trading, starting with the stable RSI at the 50 midline on the daily chart. A neutral RSI points to a tug-of-war between the bears and the bulls, resulting in market indecision.
The MACD indicator’s sell signal has been maintained since August 25, indicating that sellers have a short-term upper hand.
Still, traders should temper their bearish expectations as the MACD shows signs of stabilizing above the mean line. If the MACD line in blue crosses above the red signal line, demand for ETH could increase in tandem with risk-on sentiment, boosting the chances of a rebound toward the all-time high.
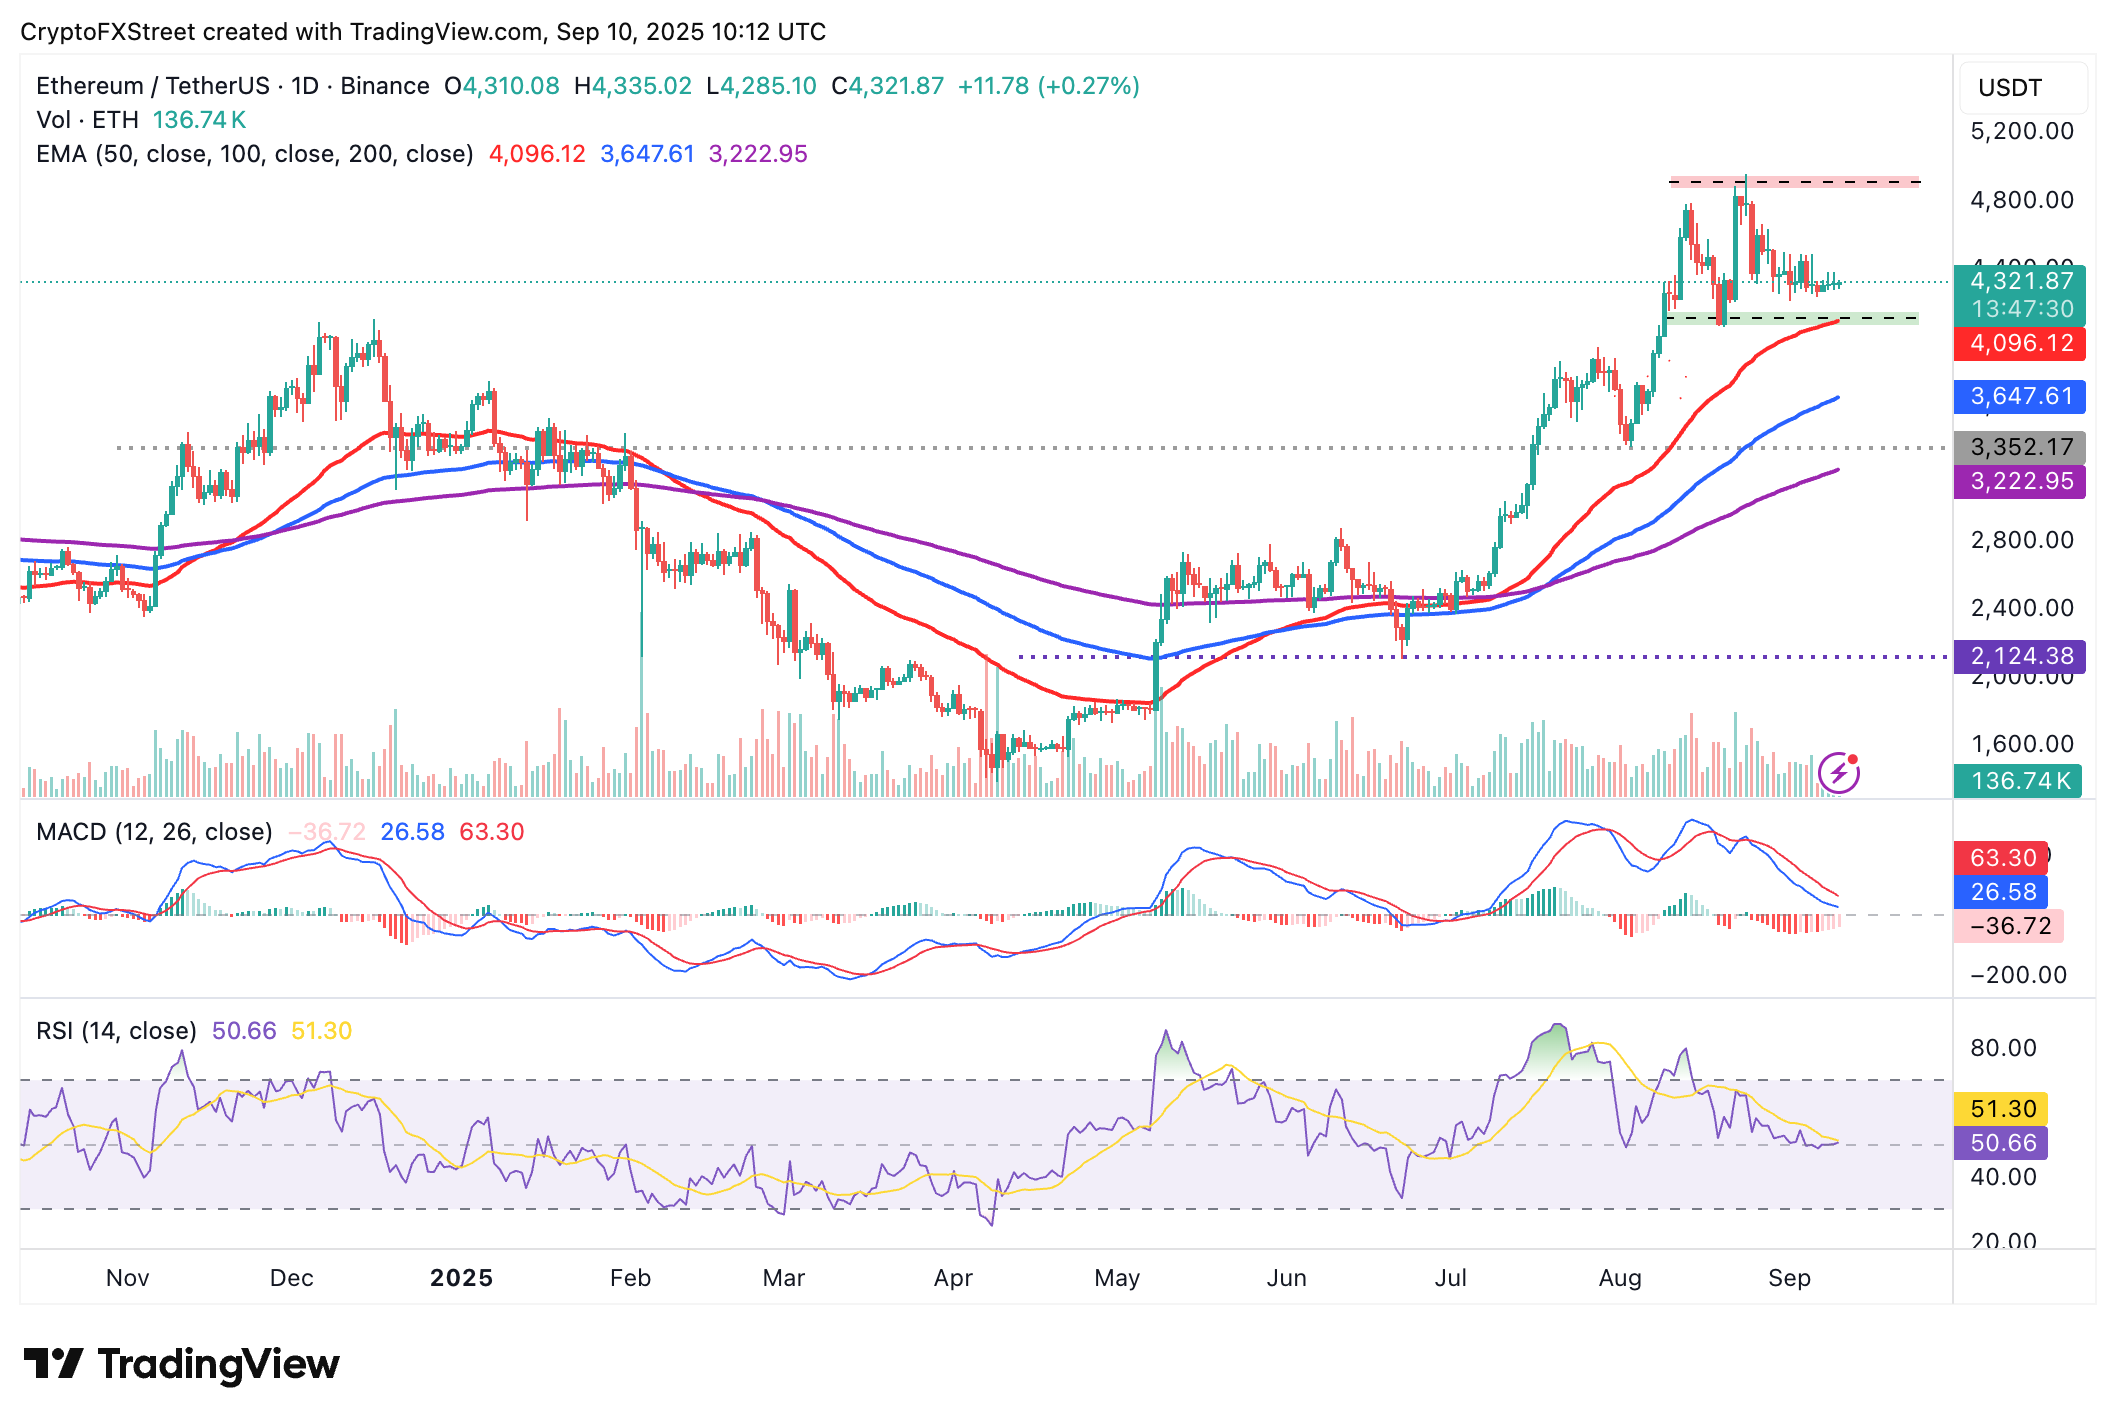
ETH/USDT daily chart
As for XRP, bulls are determined to break the stubborn resistance at $3.00 and push toward the next critical hurdle at $3.35. A descending trendline reinforces the resistance at $3.00 as shown on the daily chart below.
Key indicators to monitor for traders are the MACD, which has retained a buy signal since Sunday, and the RSI, which remains steady at 52.
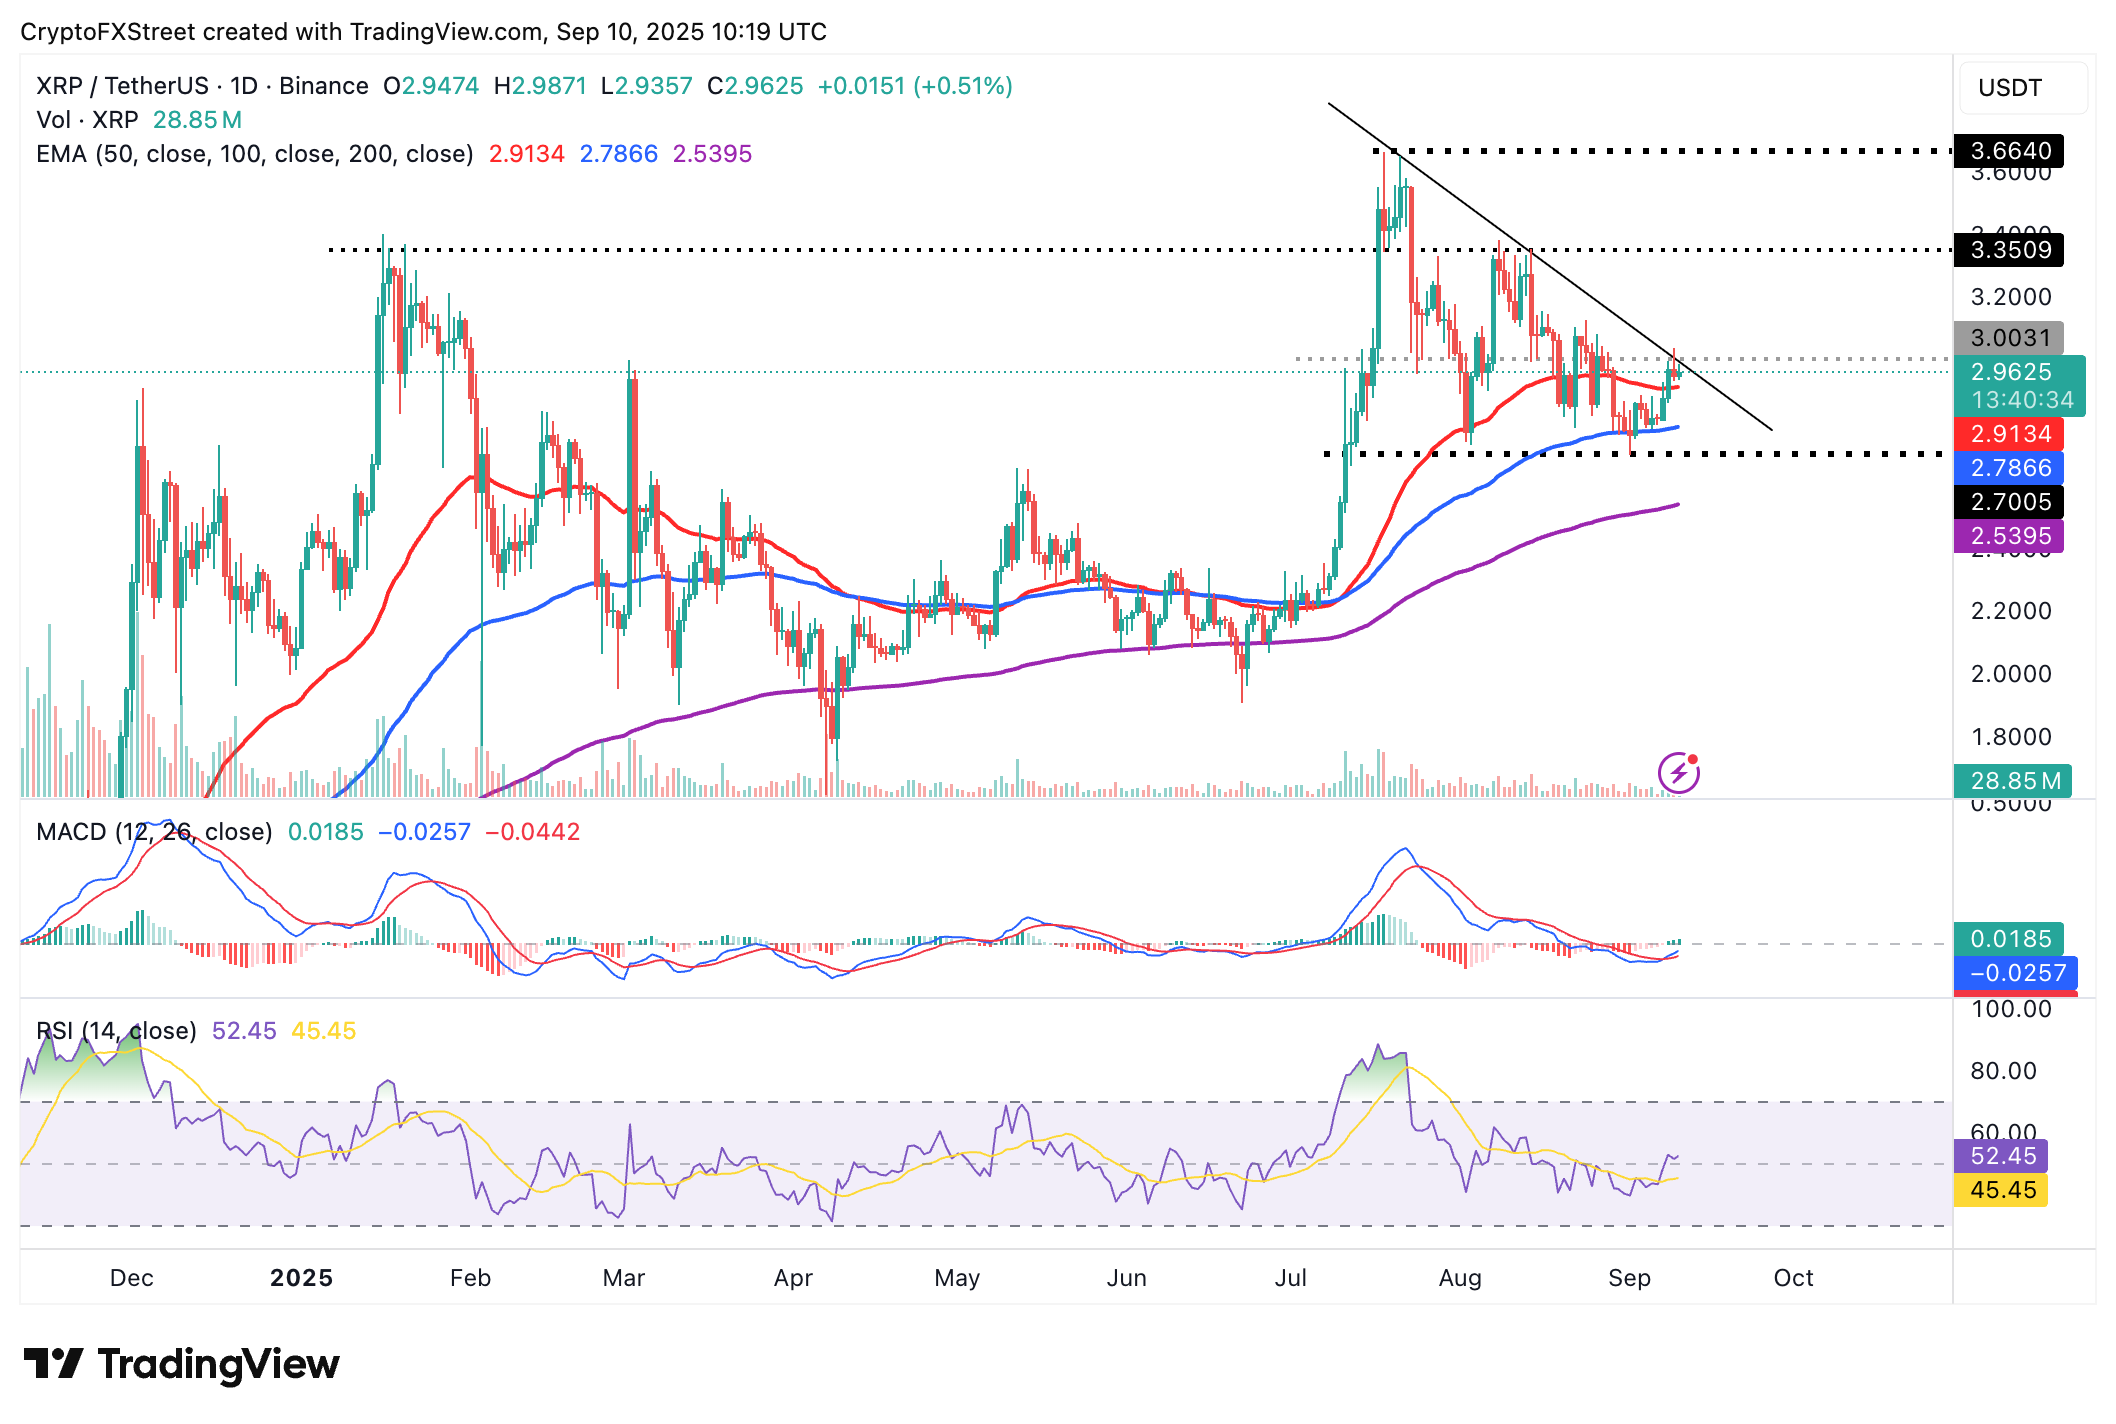
XRP/USDT daily chart
Bullish momentum will continue to increase as the RSI lifts toward overbought territory. A daily close above the descending trendline and resistance at $3.00 would affirm the bullish outlook.
Cryptocurrency prices FAQs
Token launches influence demand and adoption among market participants. Listings on crypto exchanges deepen the liquidity for an asset and add new participants to an asset’s network. This is typically bullish for a digital asset.
A hack is an event in which an attacker captures a large volume of the asset from a DeFi bridge or hot wallet of an exchange or any other crypto platform via exploits, bugs or other methods. The exploiter then transfers these tokens out of the exchange platforms to ultimately sell or swap the assets for other cryptocurrencies or stablecoins. Such events often involve an en masse panic triggering a sell-off in the affected assets.
Macroeconomic events like the US Federal Reserve’s decision on interest rates influence crypto assets mainly through the direct impact they have on the US Dollar. An increase in interest rate typically negatively influences Bitcoin and altcoin prices, and vice versa. If the US Dollar index declines, risk assets and associated leverage for trading gets cheaper, in turn driving crypto prices higher.
Halvings are typically considered bullish events as they slash the block reward in half for miners, constricting the supply of the asset. At consistent demand if the supply reduces, the asset’s price climbs.
Author

John Isige
FXStreet
John Isige is a seasoned cryptocurrency journalist and markets analyst committed to delivering high-quality, actionable insights tailored to traders, investors, and crypto enthusiasts. He enjoys deep dives into emerging Web3 tren


