XRP price risks slashing weekly gains as liquidations surge amid falling network growth
- XRP price peaked at $2.65 on Wednesday, stalling the uptrend amidst a market-wide slowdown.
- Long liquidations reach $8.44 million over the past 24 hours as the uptrend targeting $3.00 falters.
- Declining network growth signals reduced demand and engagement as fewer new addresses are created on the XRP Ledger.

Ripple (XRP) price slides slightly on Thursday to $2.51 after peaking at $2.65 on Wednesday. The two-week streak from support around $2.12 mirrored bullish sentiment in the wider crypto market, supported by strong fundamentals in the broader crypto market. However, a slump in XRP's network growth points to declining user engagement, which could inhibit the uptrend eyeing the $3.00 psychological resistance in the mid-term.
Progressive talks between the United States (US) and China resulted in a 90-day trade truce, accelerating recovery in global markets. Earlier, the US and the United Kingdom (UK) struck a bilateral trade agreement easing trade between the two nations.
XRP rally slows as network activity shrinks
The XRP Ledger showcases mixed signals with Sentiment's Network Activity metric consistently falling from nearly 16,000 addresses in January to approximately 3,400 addresses on May 7.
Declining network growth for XRP indicates fewer new addresses and reduced user engagement, signaling weaker demand. The 78.7% figure could undermine the rally, as observed with the XRP price (green line) on the chart below. Since its peak of $3.40 in January, XRP tumbled to $1.61 before reversing the trend in the second week of April.
 [07-1747287474330.12.55, 15 May, 2025].png)
Network Activity metric | Source: Santiment
Meanwhile, XRP's price hovers at $2.53, as liquidations in the derivatives market surge. CoinGlass highlights $10.14 million in liquidations over the past 24 hours. Long positions accounted for the lion's share of the liquidations at $8.44 million compared to $1.69 million in shorts.
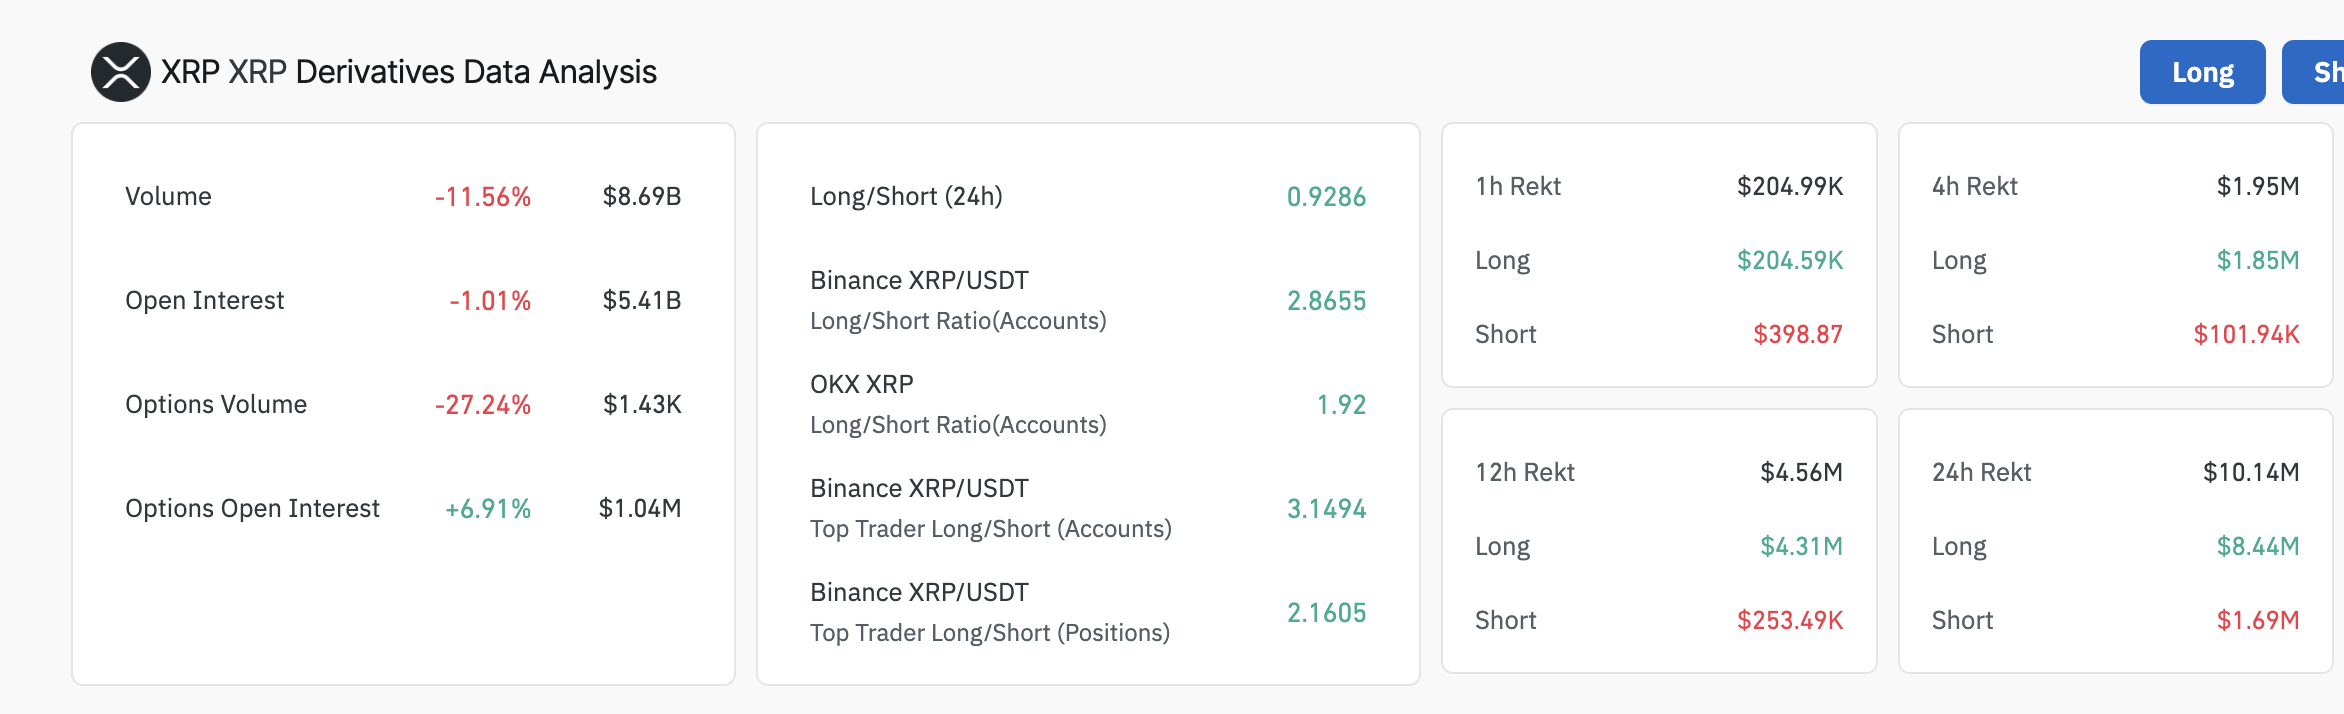
XRP derivatives market data | Source: CoinGlass
The increase in long position liquidations, as well as the drop in open interest (OI) and trading volume, hints at cooling speculative activity. Lower trading volume at $8.69 million from approximately $19.5 million on Monday implies crunching liquidity, potentially augmenting volatility, especially if traders adjust positions, increasing sell-side pressure. The slight decline in OI by 1% to $5.41 billion indicates the unwinding of leveraged positions, potentially from profit-taking or liquidations.
Looking ahead: Can XRP re-ignite the rally eyeing $3?
XRP's price sits significantly above key moving averages, including the 50-day, the 100-day and the 200-day Exponential Moving Averages (EMA), signifying a relatively strong tailwind despite the minor pullback from $2.65 reached on Wednesday.
The Moving Average Convergence Divergence (MACD) indicator upholds a buy signal above the centre line, buoyed by green histograms. This highlights a sustained bullish momentum for XRP and shows that interest in XRP is still elevated, with the uptrend likely to resume towards $3.00.
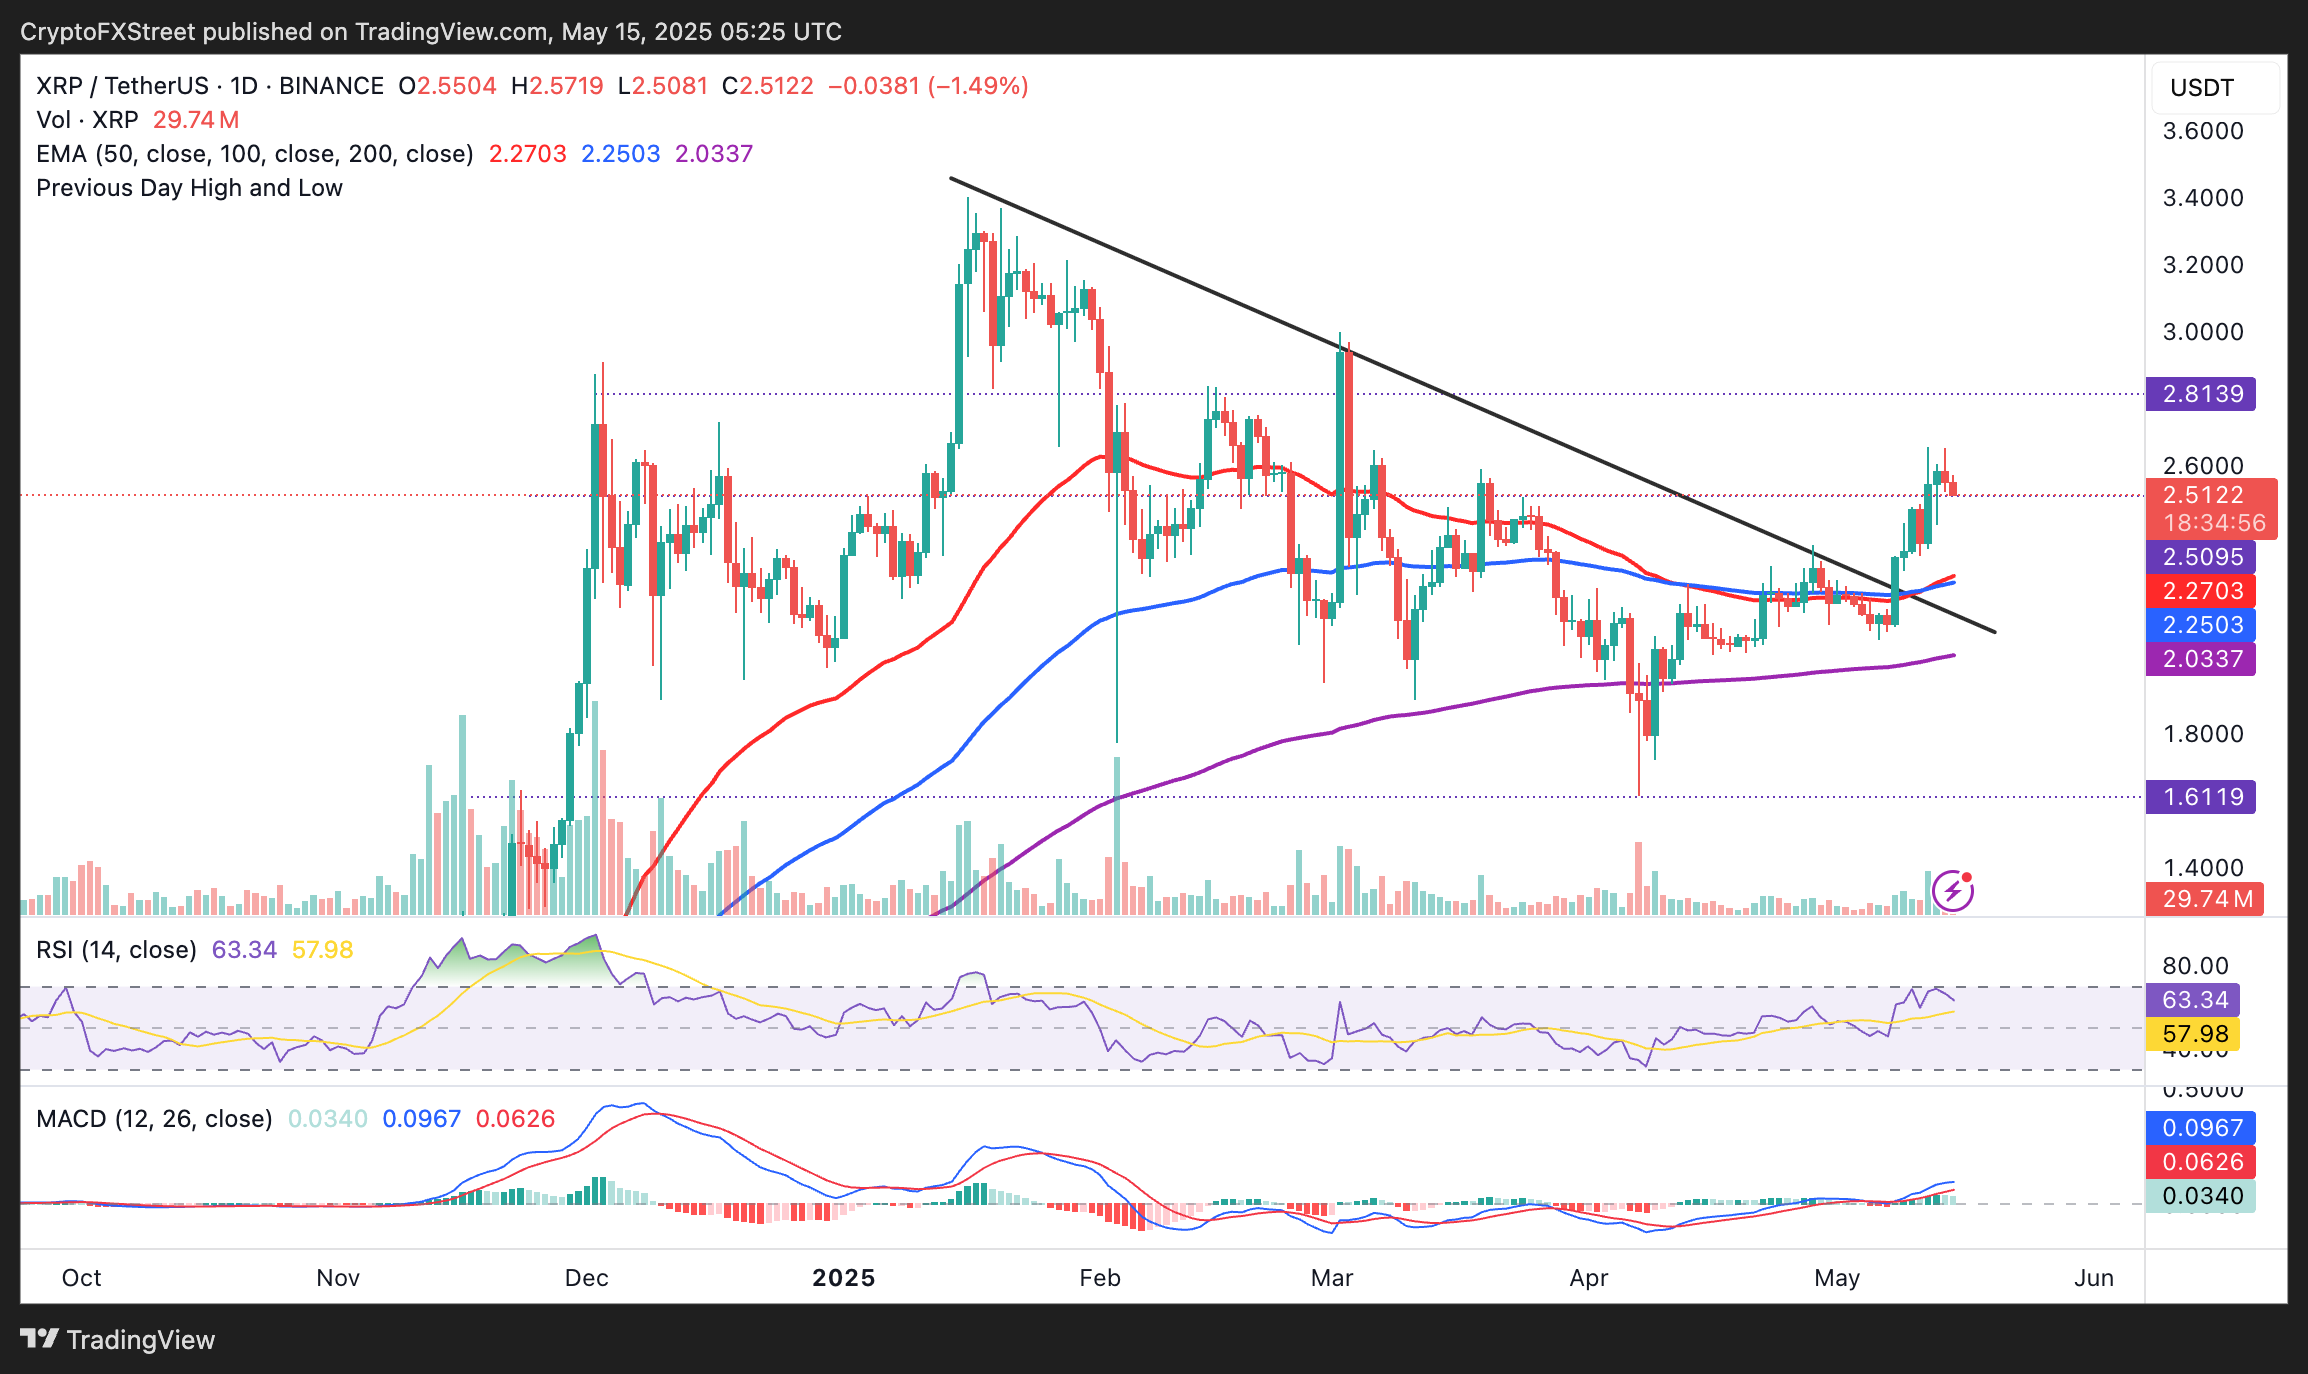
XRP/USD daily chart
Traders should consider the possibility of the down leg extending in upcoming sessions, especially with the Relative Strength Index (RSI) indicator at 63.34 and sliding toward the midline of 50, highlighting weakness in the uptrend.
If declines persist, accentuated by potential profit-taking, tentative support levels would come into play, ranging from the 50-day EMA at $2.27, the 100-day EMA at $2.25 and the 200-day EMA at $2.00.
Cryptocurrency metrics FAQs
The developer or creator of each cryptocurrency decides on the total number of tokens that can be minted or issued. Only a certain number of these assets can be minted by mining, staking or other mechanisms. This is defined by the algorithm of the underlying blockchain technology. On the other hand, circulating supply can also be decreased via actions such as burning tokens, or mistakenly sending assets to addresses of other incompatible blockchains.
Market capitalization is the result of multiplying the circulating supply of a certain asset by the asset’s current market value.
Trading volume refers to the total number of tokens for a specific asset that has been transacted or exchanged between buyers and sellers within set trading hours, for example, 24 hours. It is used to gauge market sentiment, this metric combines all volumes on centralized exchanges and decentralized exchanges. Increasing trading volume often denotes the demand for a certain asset as more people are buying and selling the cryptocurrency.
Funding rates are a concept designed to encourage traders to take positions and ensure perpetual contract prices match spot markets. It defines a mechanism by exchanges to ensure that future prices and index prices periodic payments regularly converge. When the funding rate is positive, the price of the perpetual contract is higher than the mark price. This means traders who are bullish and have opened long positions pay traders who are in short positions. On the other hand, a negative funding rate means perpetual prices are below the mark price, and hence traders with short positions pay traders who have opened long positions.
Author

John Isige
FXStreet
John Isige is a seasoned cryptocurrency journalist and markets analyst committed to delivering high-quality, actionable insights tailored to traders, investors, and crypto enthusiasts. He enjoys deep dives into emerging Web3 tren


