Ripple Price Prediction: XRP bulls hold steady, eyeing $3.00
- XRP futures Open Interest surged by more than $1 billion in the past week, driving speculative activity towards the token.
- Increasing trader interest keeps the XRP rally steady, with bulls aiming for highs above $3.00.
- Risk appetite remains elevated as whales increase exposure to XRP, betting on extended gains in the short term.

Ripple’s (XRP) price trades broadly stable at around $2.60 on Wednesday, upholding the recent bullish trend as crypto markets cheer amid improved sentiment. An increase in exposure to XRP among the whales, especially those holding more than 10 million XRP, could accelerate the rally. The uptrend mirrors a noticeable increase in the XRP futures Open Interest (OI) by over $1 billion in the past week, pointing to rising trader interest.
XRP futures open interest soars by over $1 billion in a week
XRP's consistent price increase from the tariff-triggered crash to $1.61 in April continues to attract traders and investors. Glassnode’s data released Tuesday revealed a remarkable surge in the XRP futures OI by more than 41.6%, or over $1 billion, in leverage positions in a week.
OI had been volatile since mid-February, peaking around $3.2 billion in late February before sliding to $2.2 billion around mid-March. Sideways fluctuations continued through April before surging to a three-month high of $3.42 billion.
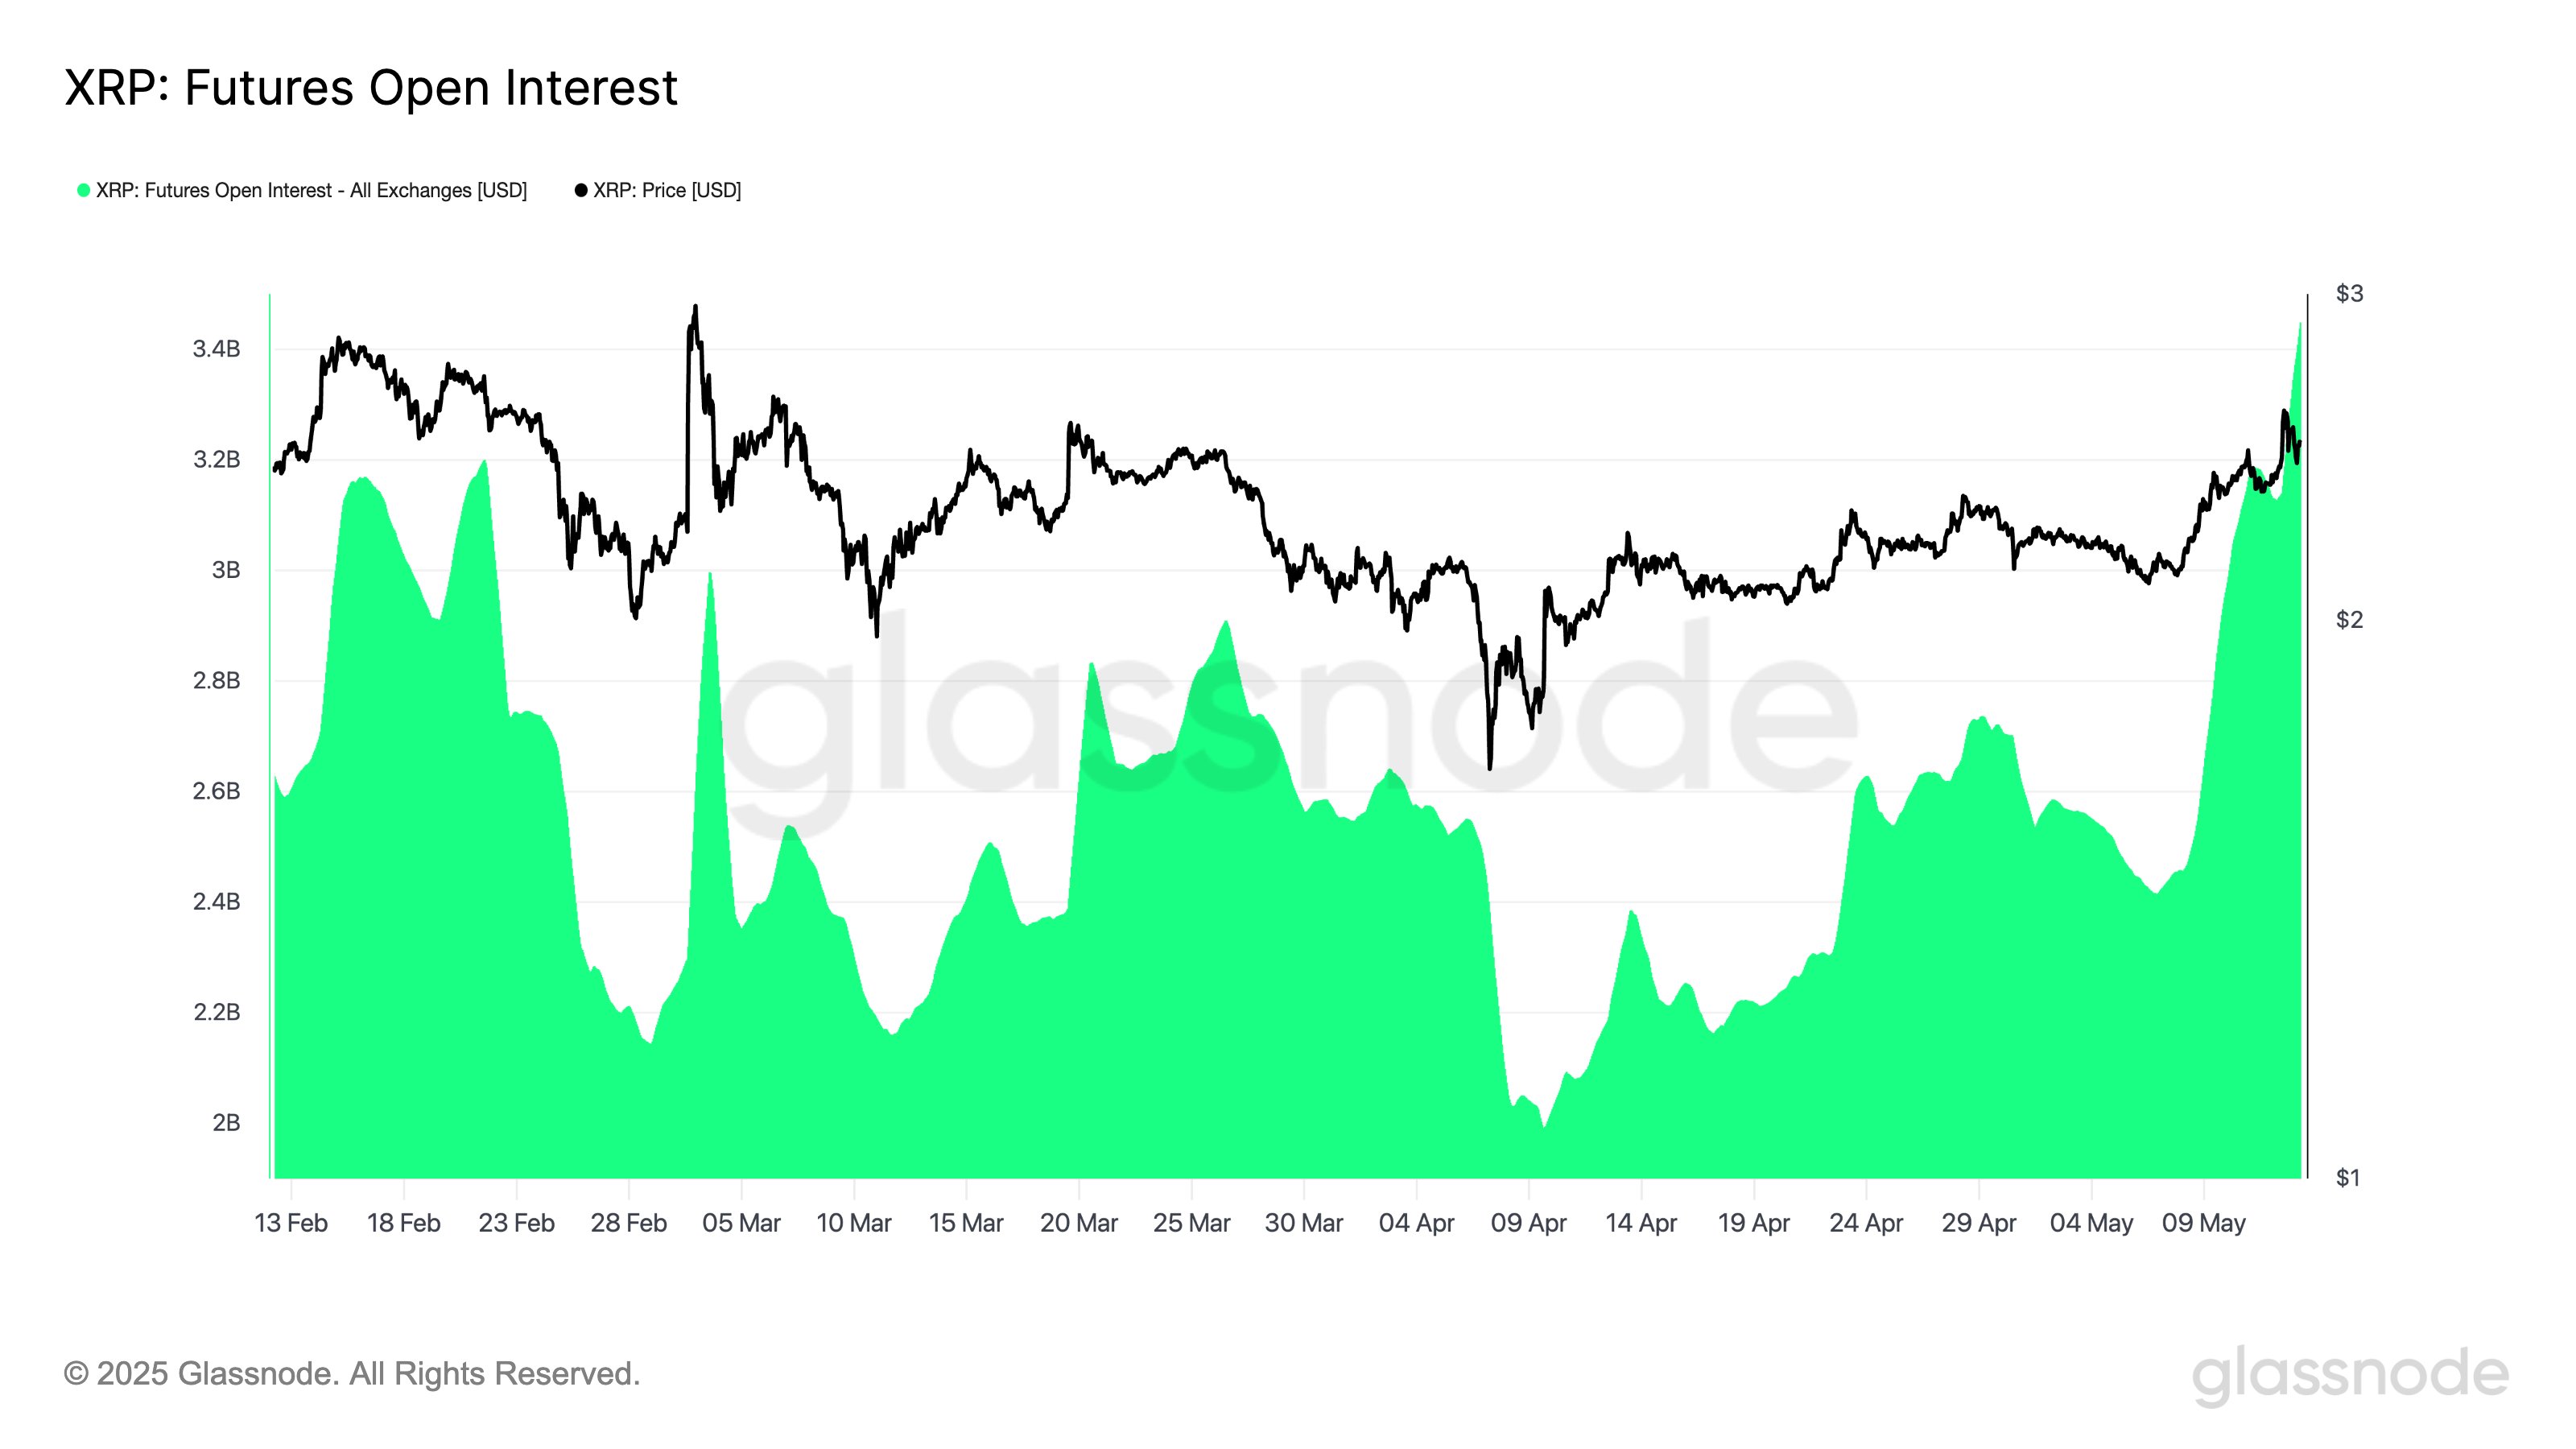
XRP futures OI data | Source: Glassnode
Rising OI signals “elevated speculative activity and growing directional conviction,” Glassnode explained in an X post. OI represents the number of outstanding futures contracts that have yet to be settled.
$XRP Futures Open Interest has surged by over $1B in the past week, rising from $2.42B to $3.42B (+41.6%). This sharp increase in leverage coincides with a price rally from $2.14 to $2.48, suggesting elevated speculative activity and growing directional conviction, pic.twitter.com/QbsaOM9oxE
— glassnode (@glassnode) May 13, 2025
Meanwhile, following the rise in OI, the futures trading volume has lost steam from Tuesday, dropping from a peak of $19.31 billion to $10.75 billion at the time of writing, per CoinGlass data.
Trading volume highlights the total amount of XRP traded in US dollars (USD) over a specific period. A drop in volume as XRP futures OI surges implies mixed signals in the market as traders respond to various dynamics and sentiment.
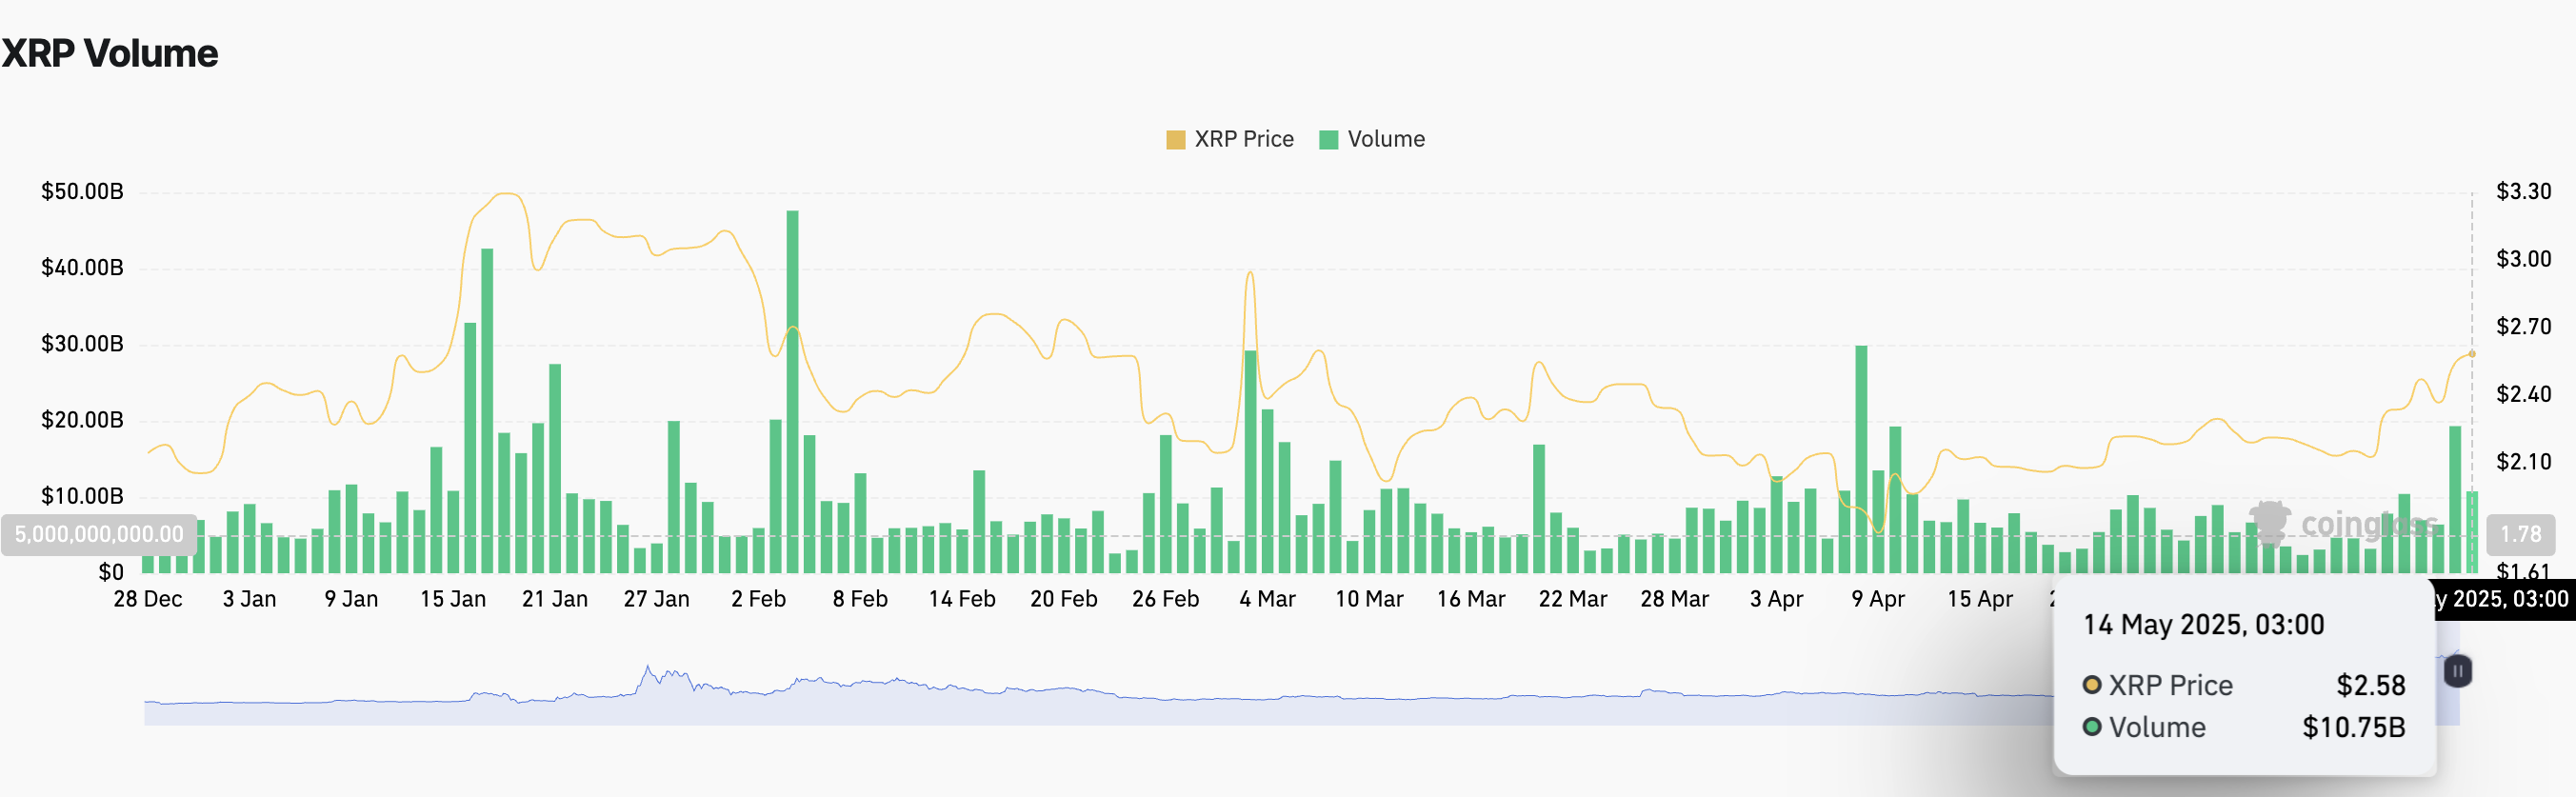
XRP futures volume | Source: Coinglass
The rise in OI occurred alongside growing risk appetite among large volume investors, who have significantly increased their exposure to XRP from mid-March. Santiment’s Supply Distribution chart below shows that addresses with between 10 million and 100 million XRP currently hold 12.22% of the supply, up from 10.76% on March 17.
On the other hand, investors with over 1 billion coins have recently renewed interest in XRP after selling at April’s peak price of $2.36. This cohort now accounts for 39.13% of the supply, up from 37.53% recorded on May 3.
 [08-1747212173797.50.42, 14 May, 2025].png)
Supply Distribution metric | Source: Santiment
Increased risk appetite as whales buy XRP signals confidence, boosting demand and potentially driving the price towards the mid-term target of $3.00. Traders may see heightened volatility, with opportunities for gains but also risks of a sharp correction if whales sell to realise profit.
Looking ahead: XRP bulls hold steady, eyeing $3.00
XRP’s price hovers around $2.60 at the time of writing, reflecting increasing trading volume and trader confidence in the uptrend targeting highs past $3.00. The cross-border money transfer token sits significantly above key moving averages, including the 50-day Exponential Moving Average (EMA) at $2.26, the 100-day EMA at $2.24 and the 200-day EMA at $2.02, adding credence to the bullish outlook.
The Moving Average Convergence Divergence (MACD) indicator in the daily time frame validates the bullish momentum as it lifts above the centre line. This, and the MACD line’s (blue) crossing above the signal line (red) and the expanding green histograms, suggest that XRP has the potential to close the gap toward $3.00.
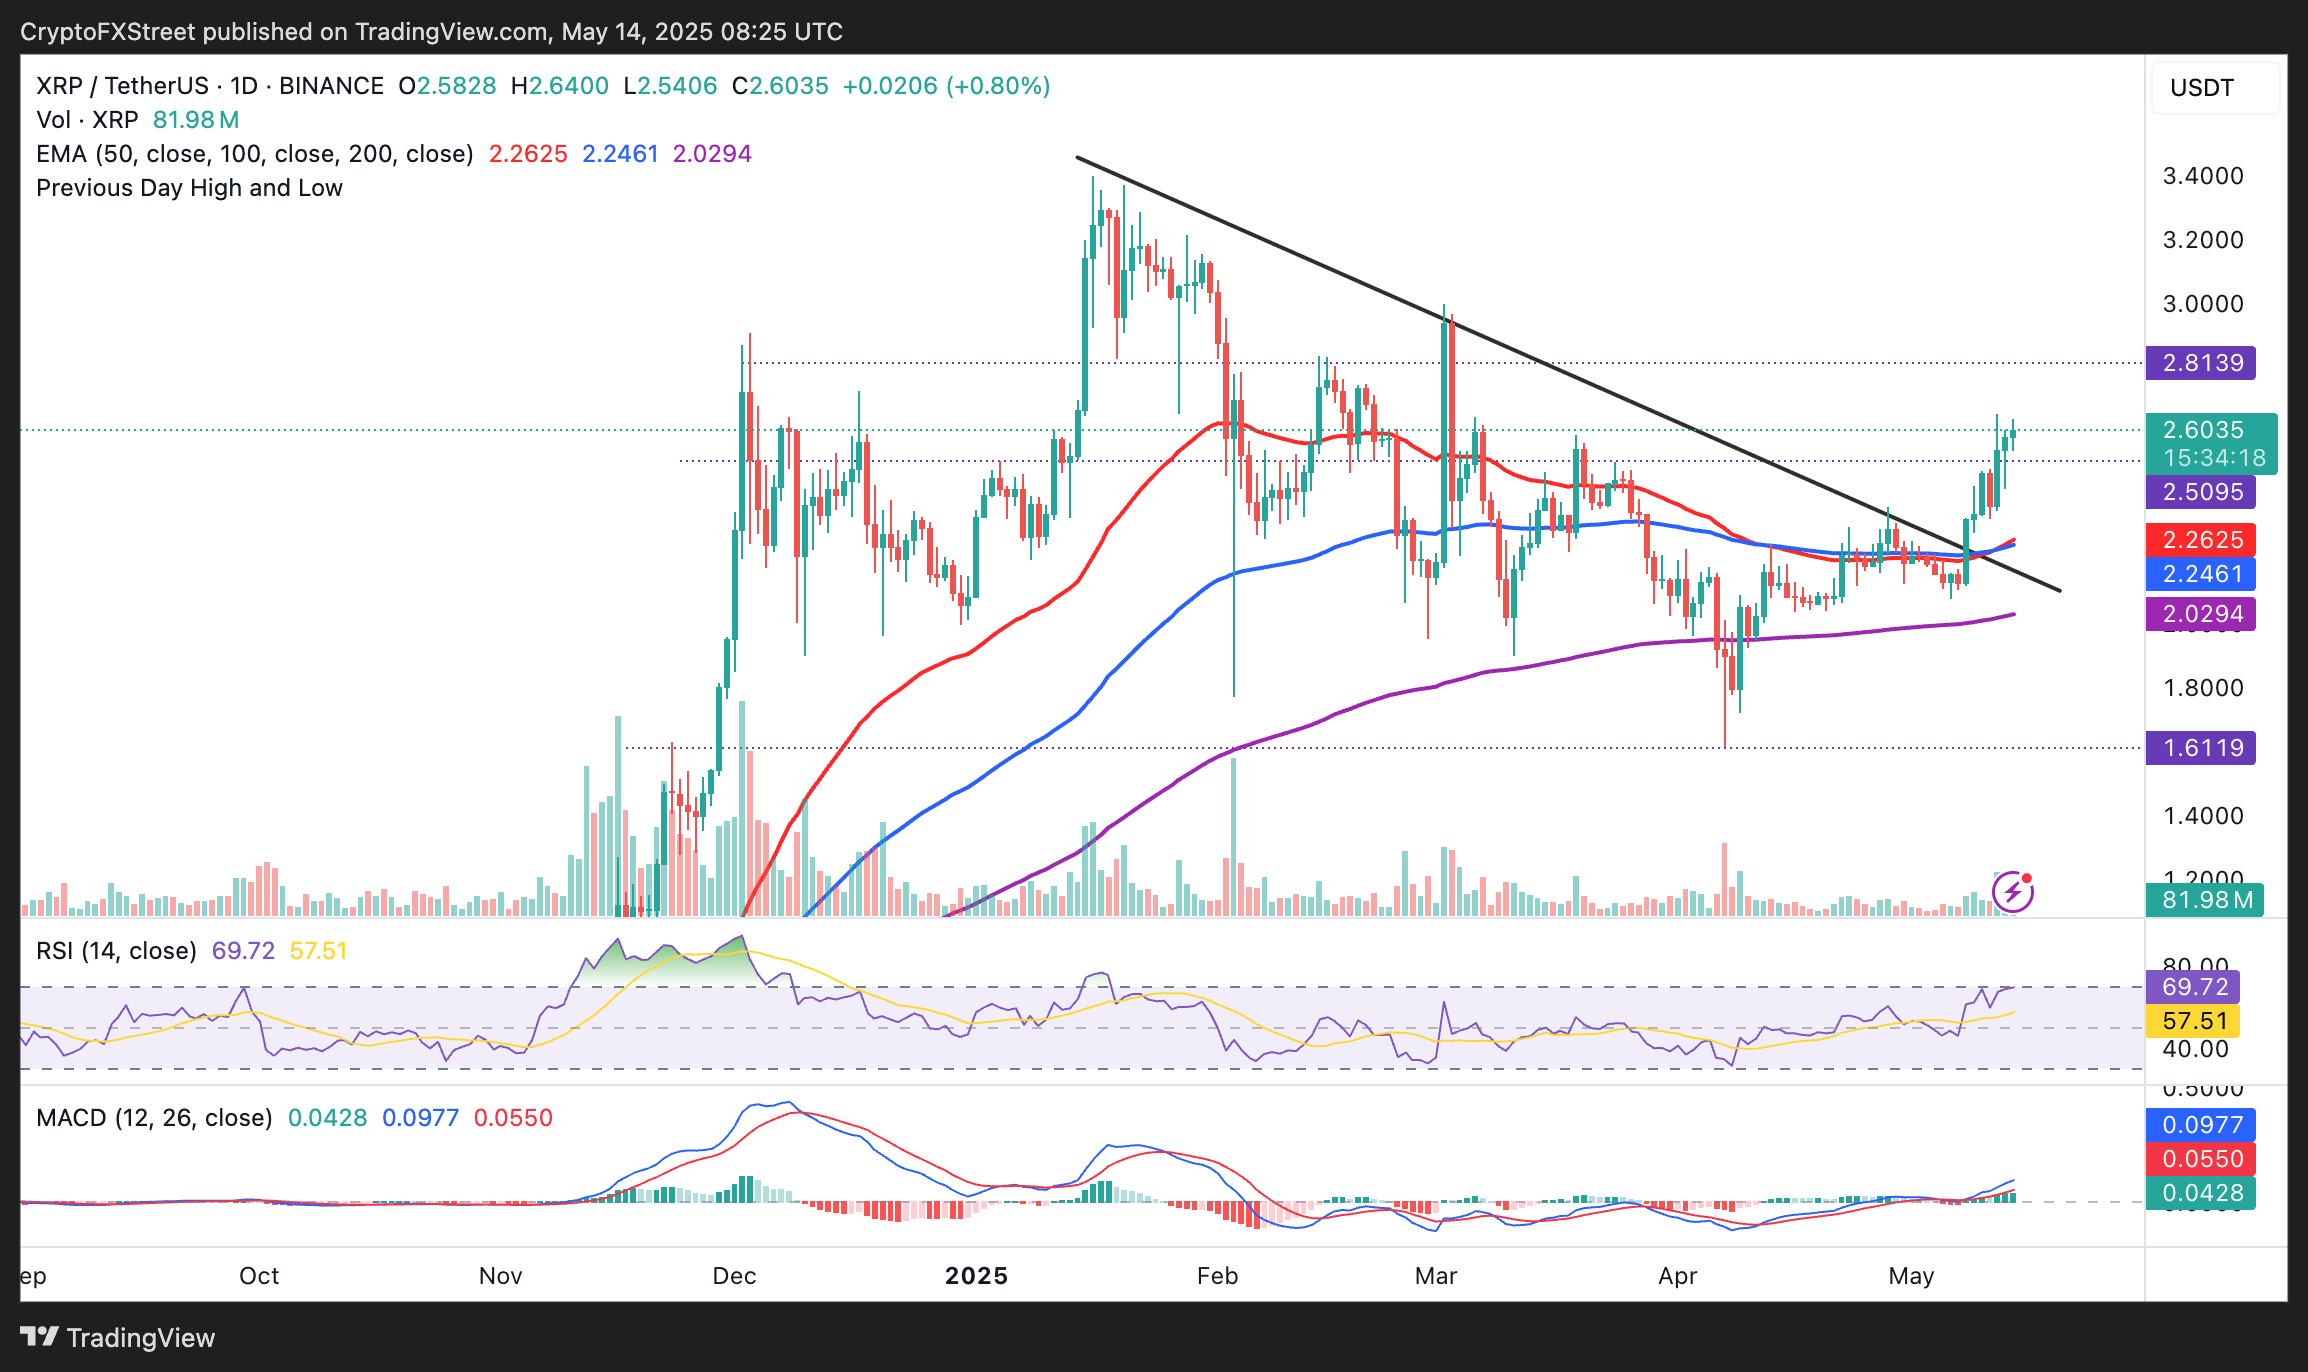
XRP/USDT daily chart
XRP’s Relative Strength Index (RSI) at 69.71 nears overbought territory, reflecting robust bullish momentum. While this underscores a strong uptrend, it also flags a potential correction risk if traders opt to lock in profits at current levels.
The RSI’s potential reversal towards the midline of 50 could imply buyer exhaustion and a possible drawdown toward short-term support at $2.50, tested as resistance in March, the 50-day EMA at $2.26, the 100-day EMA at $2.24 and the 200-day EMA at $2.02.
Open Interest, funding rate FAQs
Higher Open Interest is associated with higher liquidity and new capital inflow to the market. This is considered the equivalent of increase in efficiency and the ongoing trend continues. When Open Interest decreases, it is considered a sign of liquidation in the market, investors are leaving and the overall demand for an asset is on a decline, fueling a bearish sentiment among investors.
Funding fees bridge the difference between spot prices and prices of futures contracts of an asset by increasing liquidation risks faced by traders. A consistently high and positive funding rate implies there is a bullish sentiment among market participants and there is an expectation of a price hike. A consistently negative funding rate for an asset implies a bearish sentiment, indicating that traders expect the cryptocurrency’s price to fall and a bearish trend reversal is likely to occur.
Author

John Isige
FXStreet
John Isige is a seasoned cryptocurrency journalist and markets analyst committed to delivering high-quality, actionable insights tailored to traders, investors, and crypto enthusiasts. He enjoys deep dives into emerging Web3 tren


