Ripple Market Update: All eyes on the upcoming Swell event as XRP keeps getting rejected at key resistance level
- Ripple’s Swell 2020 conference will be held virtually on October 14 and 15.
- XRP tends to drop during and after the Swell conference.

Swell is Ripple’s annual conference held by the American technology company Ripple. First announced in August 2017, it’s an interactive conference that brings together the top figures in the digital currency and blockchain worlds. In 2020, the event will be held virtually on October 14 and 15.
The two keynote speakers announced for the event are Sheila Warren - Head of Blockchain, Digital Assets, and Data Policy for World Economic Forum - and Mahesh Uttamchandani - the Practice Manager for Financial Inclusion, Infrastructure & Access in the Finance, Competitiveness, and Innovation Global Practice at the World Bank Group.
Historical Impact of Swell on the price
#1 Swell 2017
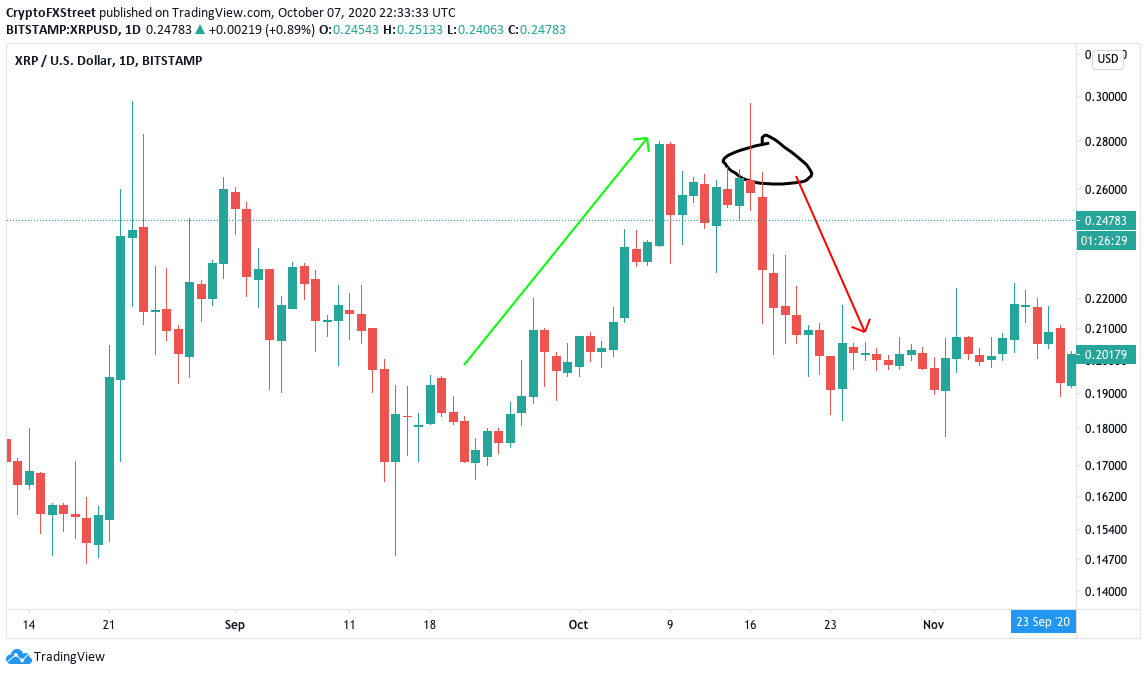
The first-ever Swell conference was held in Toronto from October 16–18 in 2017. Leading up to the event, the price went up from $0.17 to $0.278. Following that, XRP dropped to $0.191.
#2 Swell 2018
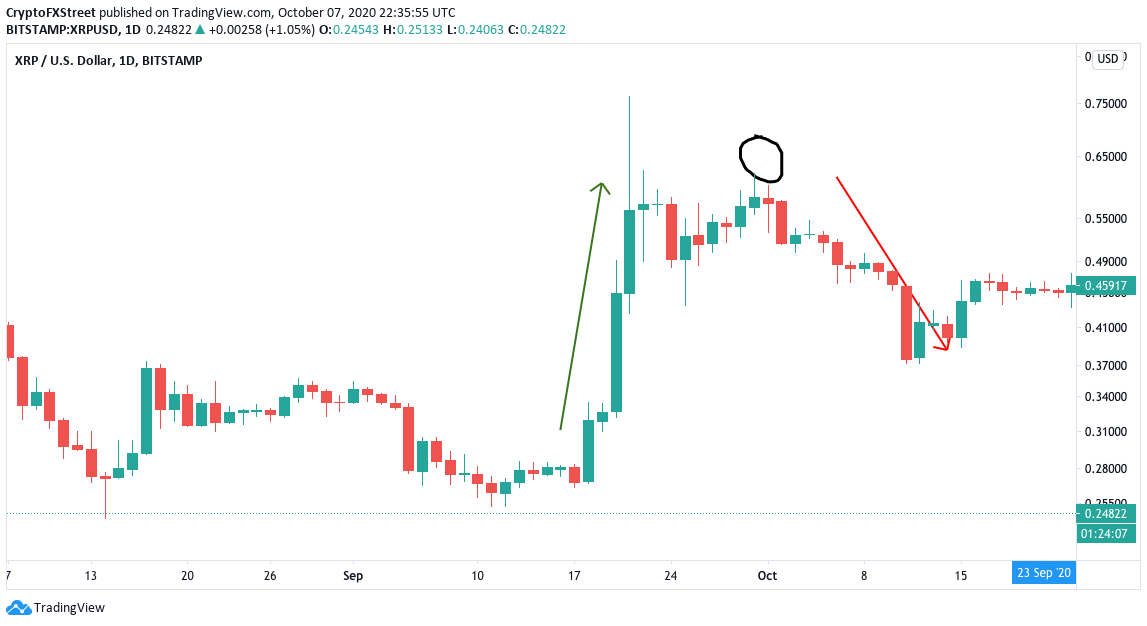
The 2018 Swell event took place between 30th September 2018 - 2nd October 2018 in San Francisco. A week prior to the event, XRP went up from $0.269 to $0.57. Immediately following and during the event, the price dropped to $0.375.
#3 Swell 2019
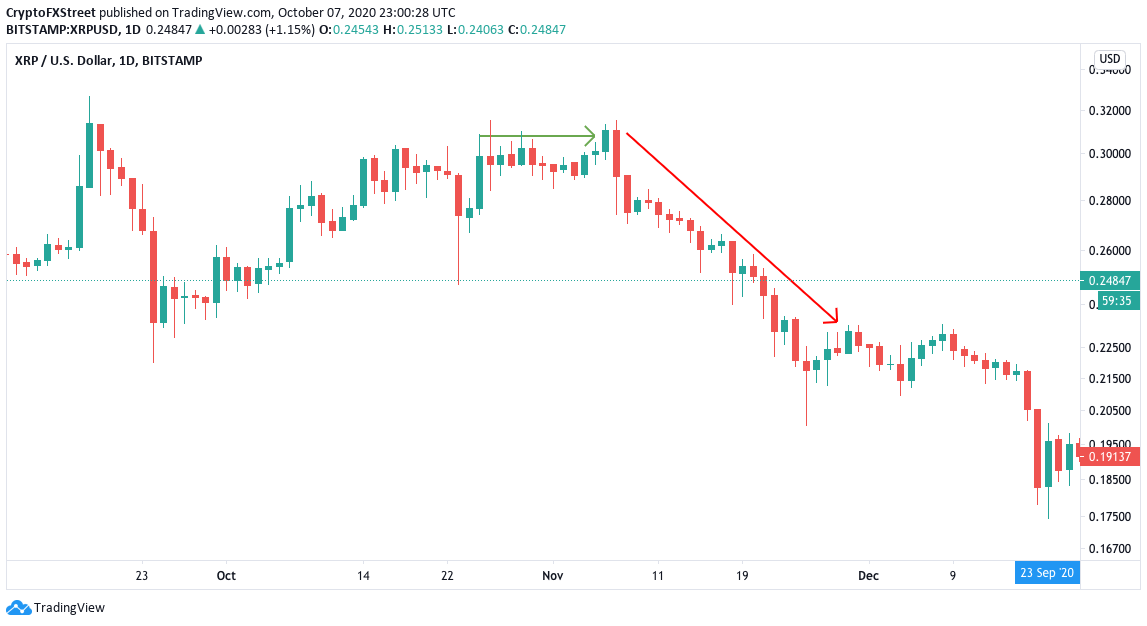
The 2019 version took place in Singapore and on the 7th and 8th of November. Before the event, XRP trended horizontally $0.30 and, following the event, it crashed to $0.217
The technical picture right now
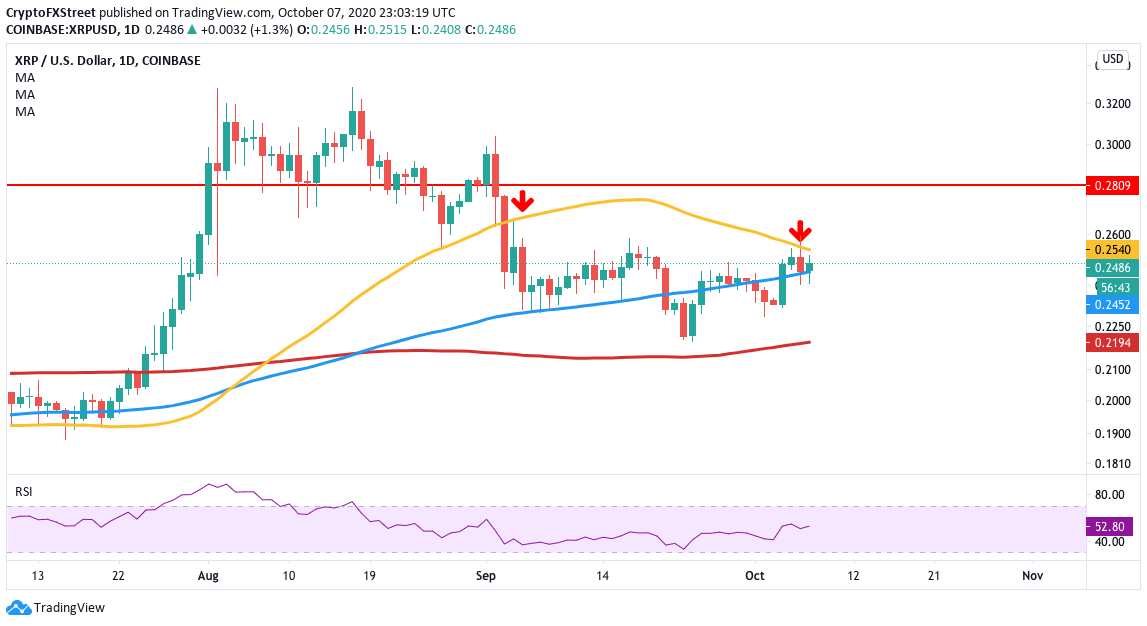
Currently, XRP’s upside potential is severely limited by the 50-day SMA, which has already rejected the price twice and is trading around the $0.25-mark. As we have seen, XRP tends to fall during and after the Swell event. With these repeated rejections, we can expect XRP to break below the 100-day SMA support and fall to the 200-day SMA ($0.2194).
XRP/USD daily chart
The flipside – Can the bulls turn this equation around?
While the long-term outlook looks bearish, let’s check out some other metrics that could potentially flip our bearish thesis around.
Santiment’s “Holder Distribution” chart helps us visualize the activity of investors with a large amount of XRP tokens, aka whales. The chart breaks down the number of addresses based on the number of tokens they hold.
XRP holder distribution
 [04.52.56, 08 Oct, 2020]-637377108348777534.png)
As per the chart, the number of holders with 100,000 to 1 million XRP has risen steadily in the three-month time frame. The number of holders with 1 million to 10 million XRP went up from 1,326 to 1,339 over the last two weeks. Finally, the number of whales with >10 million XRP suffered a dip but has since gone up from 308 to 310 over the last couple of days. So, it looks like the whales are consolidating their positions, which is a positive sign for XRP.
Looking back at the daily chart, if the bulls do somehow take back control and break above the 50-day SMA curve, they have the clearance to go up to $0.28 before encountering the next significant resistance level.
Verdict: With repeated rejections at the 50-day SMA curve, it looks likely that the price will drop to 200-day SMA ($0.2194). However, if the buyers somehow manage to break above the 50-day SMA, they should be able to take the price up to $0.28 before it encounters significant resistance. However, the upcoming Swell Conference historically has a bearish effect on the price.
Author

Rajarshi Mitra
Independent Analyst
Rajarshi entered the blockchain space in 2016. He is a blockchain researcher who has worked for Blockgeeks and has done research work for several ICOs. He gets regularly invited to give talks on the blockchain technology and cryptocurrencies.




