Price analysis 3/6: SPX, DXY, BTC, ETH, BNB, XRP, ADA, MATIC, DOGE, SOL

Stock markets continue to trend upward, while crypto investors wait for this week’s Federal Reserve statements before choosing which direction BTC and altcoin prices will take.
The United States equities markets are trying to extend their recovery at the start of the new week. One of the reasons that could be boosting investor confidence is that the yield on the benchmark 10-year note has slipped further to 3.924%.
However, the bullish sentiment of the equities markets has not rubbed off on the cryptocurrency markets which continue to underperform. Bitcoin’s tight range trading since March 4 suggests that there is uncertainty about the next directional move.
Generally, periods of low volatility are followed by a pick-up in volatility. The congressional testimony of Federal Reserve Chair Jerome Powell on March 7 and March 8 will be watched for the outlook on inflation and rate hikes. Later, on March 10, the release of February's job report could add to the volatility.
Could the strength in the U.S. equities markets and the weakness in the U.S. dollar index(DXY) attract buying in the beaten-down cryptocurrency sector? Let’s study the charts to find out.
SPX
The S&P 500 index (SPX) turned up sharply from 3,928 on March 2, indicating that buyers have not given up and are accumulating at lower levels.
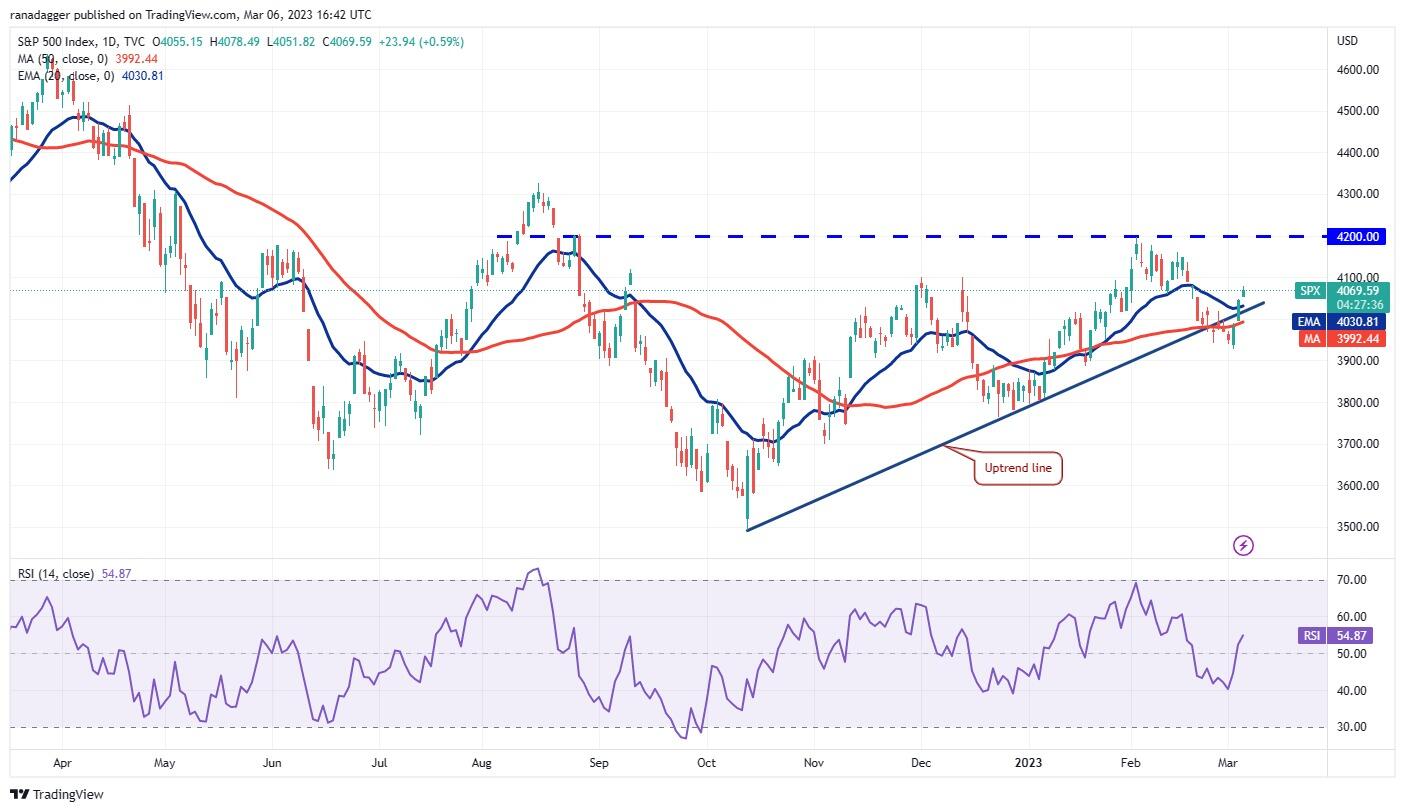
SPX daily chart. Source: TradingView
Buyers pushed the price above the 20-day exponential moving average (4,030) on March 3 and followed it up with another move higher on March 6. The rise back above the uptrend line could have trapped the aggressive bears who may be rushing to the exit. The index will try to rise to 4,200 and then to 4,300.
On the contrary, if the price turns down from the current level or the overhead resistance and breaks below the moving averages, it will suggest that bears are back in the game. A break and close below 3,928 could open the gates for a possible drop to 3,764.
DXY
The recovery in the U.S. dollar index (DXY) is facing selling near the 38.2% Fibonacci retracement level of 105.52 but a minor positive in favor of the buyers is that they have not allowed the price to slip below the 20-day EMA (104.10).
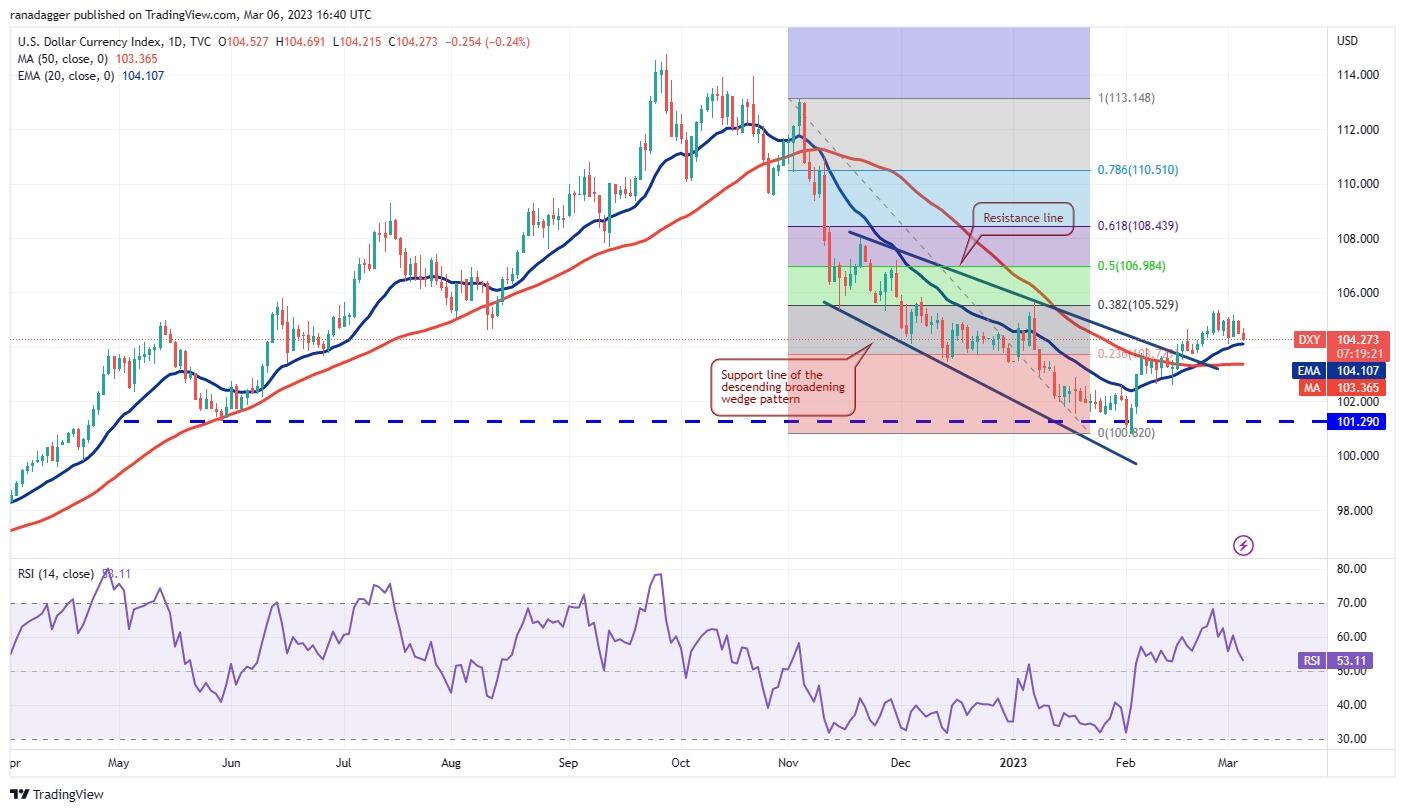
DXY daily chart. Source: TradingView
If the price bounces off the 20-day EMA, the bulls will again try to drive the index above the overhead resistance. If they succeed, the index could rally to the 50% retracement level of 106.98 and then to the 61.8% retracement level of 108.43.
Instead, if the price turns down and breaks below the 20-day EMA, the next stop may be the 50-day SMA (103.36). Such a move will suggest that the index may consolidate between 101.29 and 105.52 for some time.
BTC/USDT
Bitcoin is struggling to climb back above $22,800, indicating that the bears are trying to flip the level into resistance. The moving averages are about to complete a bearish crossover and the relative strength index (RSI) is in the negative zone, signaling advantage to the bears.
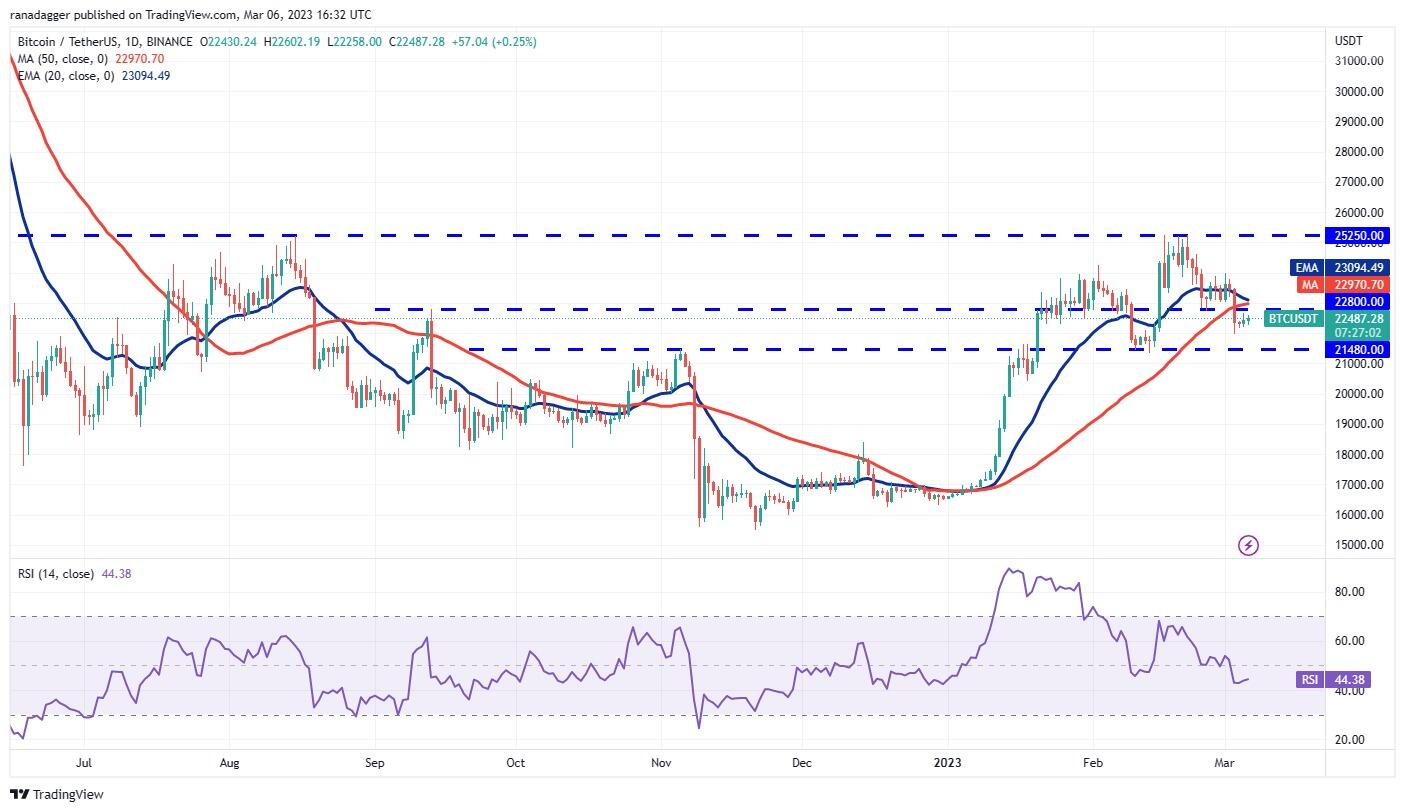
BTC/USDT daily chart. Source: TradingView
If the price turns down from the current level, the BTC/USDT pair may drop to the critical support at $21,480. This level may witness a tough battle between the bulls and the bears. If the bears come out on top, the pair may extend its decline to the psychologically important level of $20,000.
On the other hand, if the price rebounds off $21,480, the bulls will make one more attempt to clear the overhead hurdle at $22,800. If they manage to do that, the pair may start its up-move toward $25,250.
ETH/USDT
Ether has been trading in a tight range following the sharp fall on March 3. This indicates indecision among the buyers and sellers.
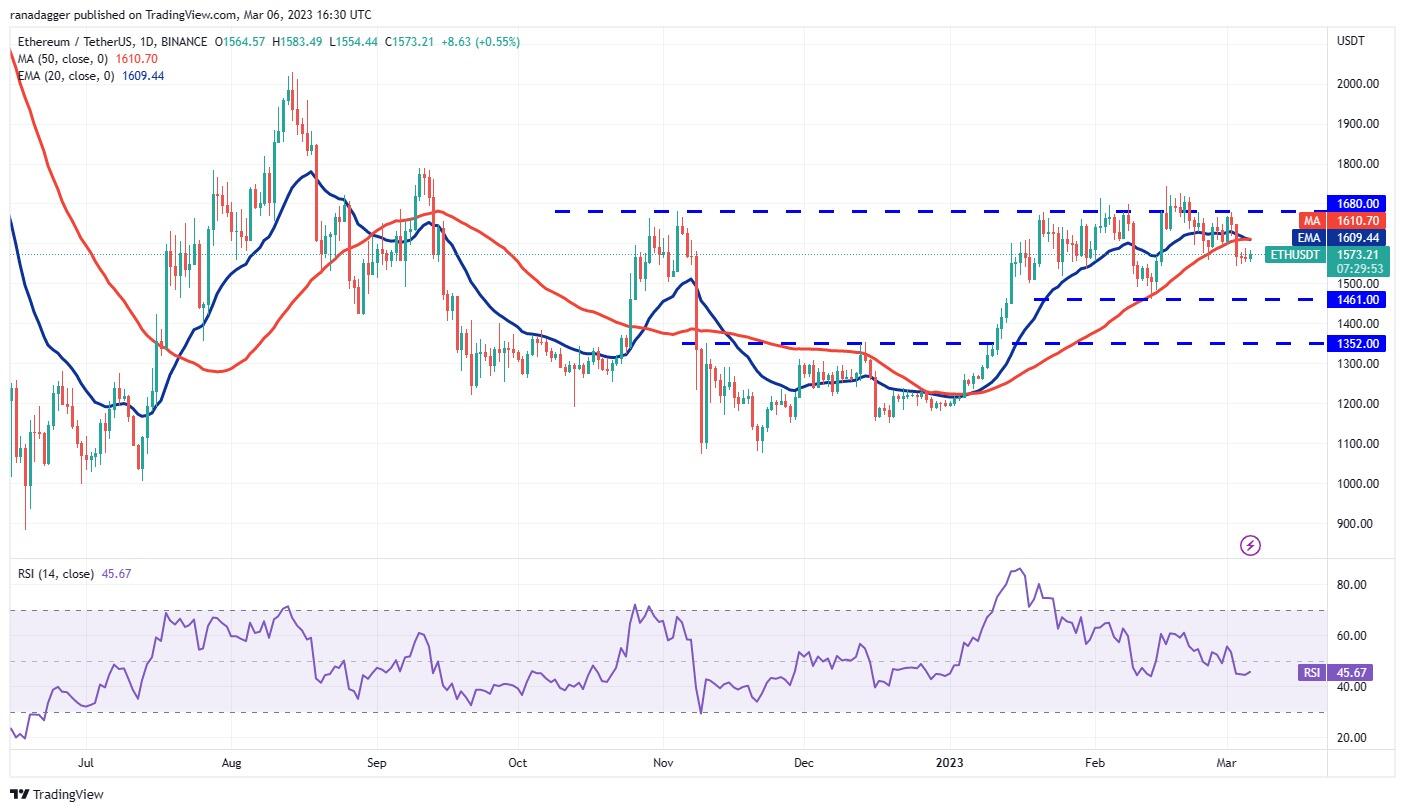
ETH/USDT daily chart. Source: TradingView
If bears sink the price below $1,544, the advantage could tilt in their favor and the ETH/USDT pair may slump toward the strong support at $1,461. This level is again likely to behave as a strong support. If the price springs back from this level, the pair may remain stuck between $1,461 and $1,743 for a while longer.
On the upside, the bulls will have to push and sustain the price above the moving averages to signal a comeback. The pair may then attempt to climb above the $1,680 to $1,743 resistance zone. If that happens, the pair may start its journey toward $2,000.
BNB/USDT
BNB’s shallow pullback from the current level shows a lack of aggressive buying by the bulls. The downsloping 20-day EMA ($301) and the RSI in the negative territory indicate that the path of least resistance is to the downside.
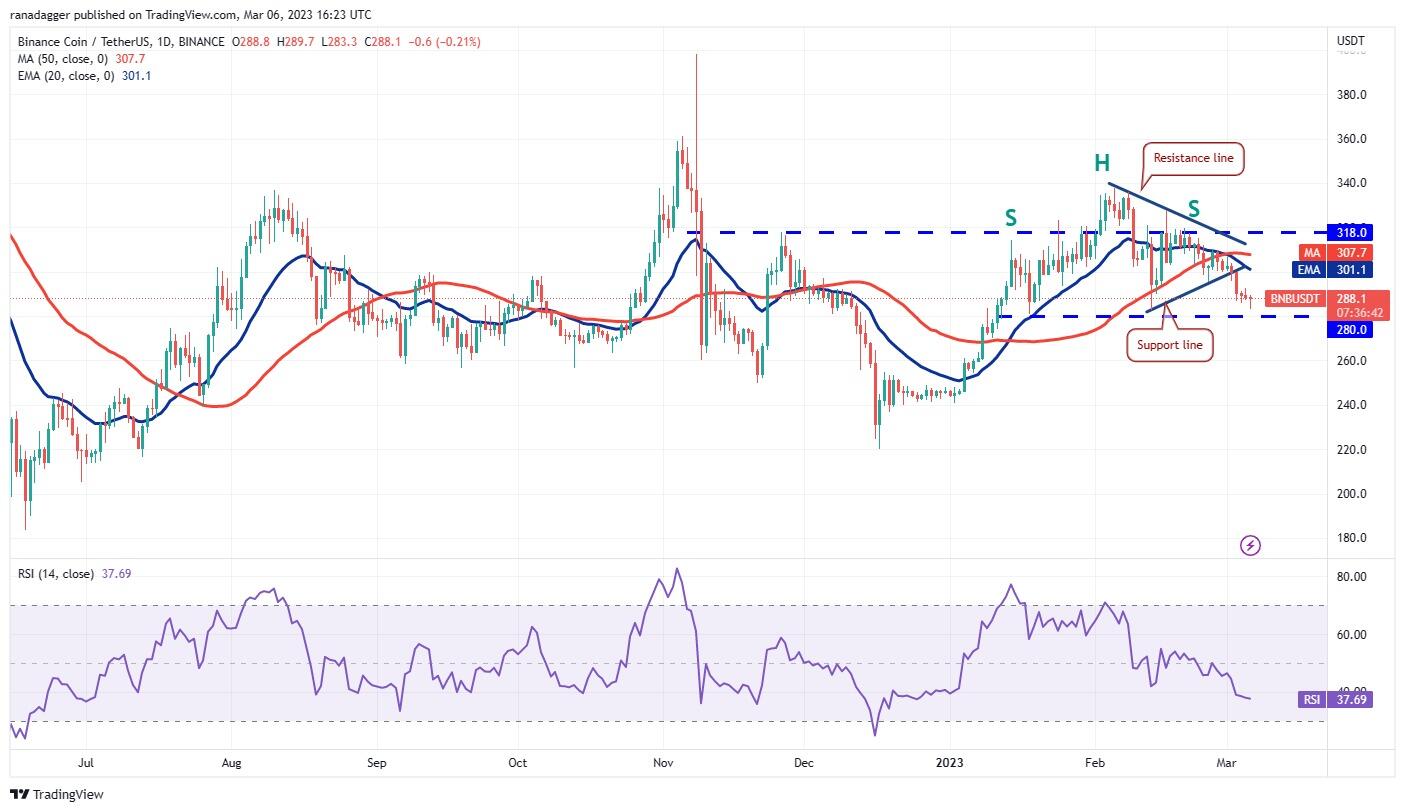
BNB/USDT daily chart. Source: TradingView
If bears sink the price below $280, the BNB/USDT pair will complete a bearish head and shoulders (H&S) pattern. That could start a downward move toward the first target at $245 and thereafter $222.
If bulls want to prevent the downturn, they will have to fiercely defend the $280 support and quickly push the price above the 20-day EMA. That could increase the possibility of a rise to the overhead resistance at $318.
XRP/USDT
XRP’s rebound off the $0.36 support on March 3 met with strong selling near the 20-day EMA ($0.38). This suggests that the sentiment is negative and traders are selling on rallies.
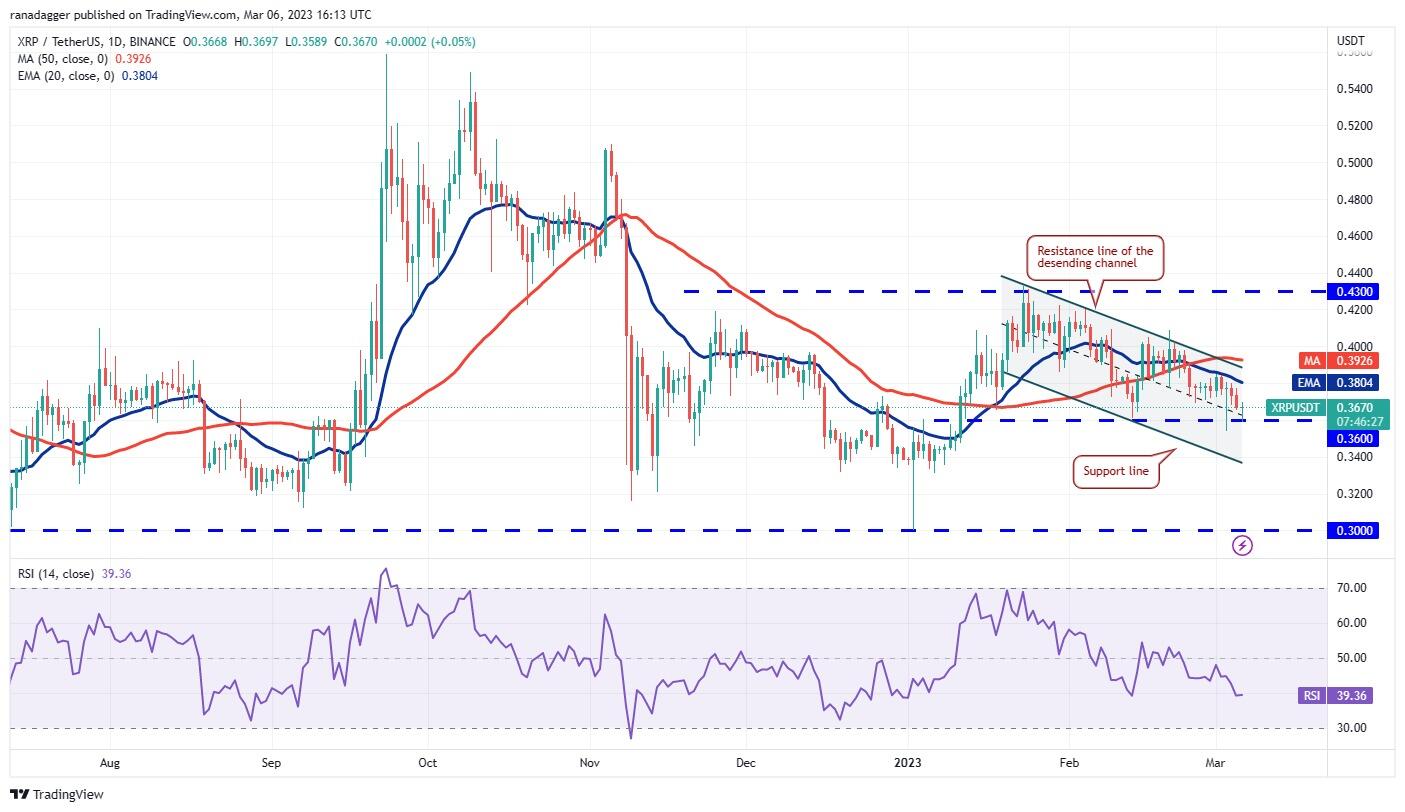
XRP/USDT daily chart. Source: TradingView
If the price tumbles below $0.36, the XRP/USDT pair could reach the support line of the descending channel pattern. Buyers may buy this dip to keep the pair inside the channel but could find it difficult to overcome the obstacle at $0.36.
The first sign of strength will be a break and close above the resistance line of the channel. That could attract further buying and the pair may attempt a rally to $0.43 where they are likely to encounter stiff resistance from the bears.
ADA/USDT
Cardano bounced off the $0.32 support on March 3 but the bulls could not propel the price above the overhead resistance at $0.34. This shows that the rallies are being sold into.
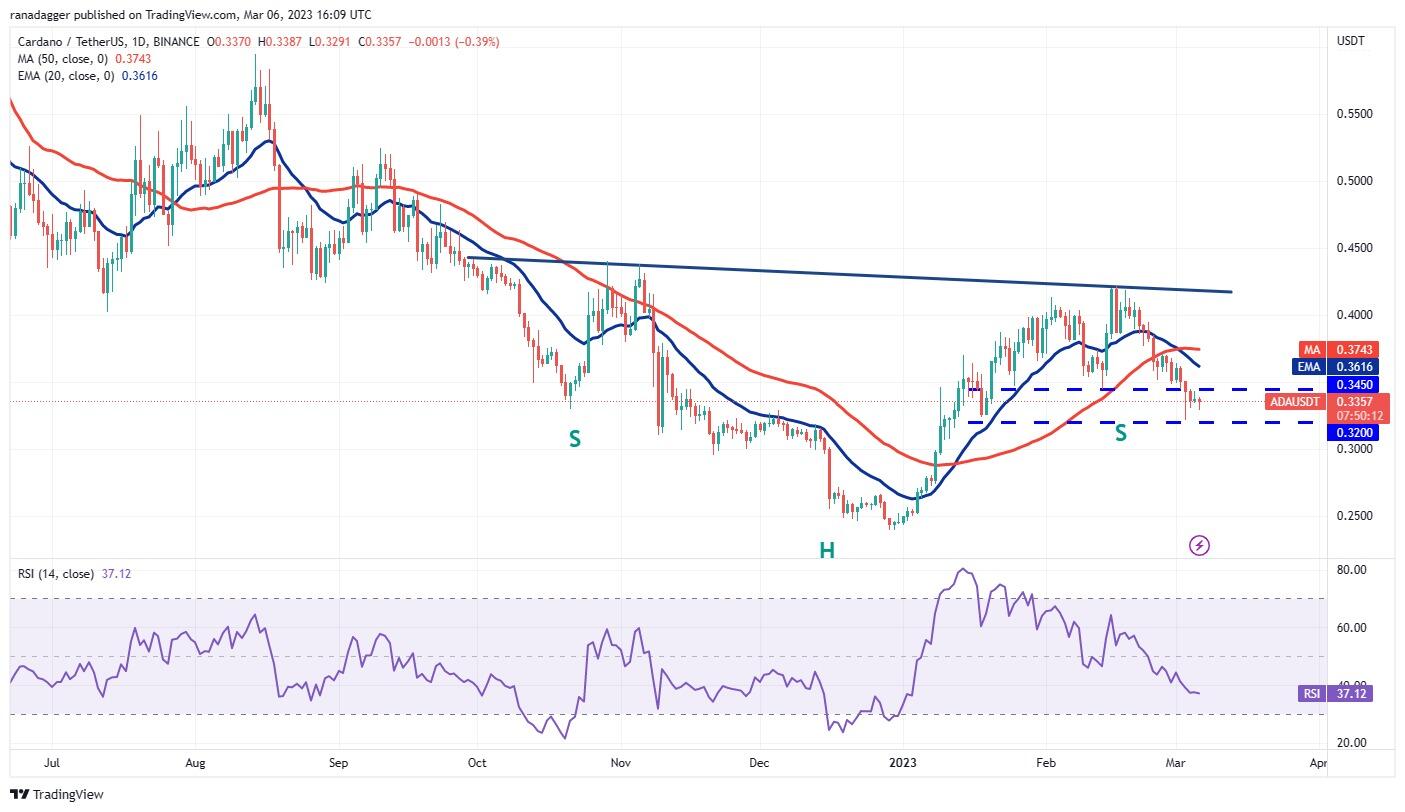
ADA/USDT daily chart. Source: TradingView
The bears will again try to sink the price below the $0.32 support. If they can pull it off, the ADA/USDT pair could witness aggressive selling. There is no major support until the pair reaches $0.26.
This negative view could invalidate in the near term if the price rebounds off $0.32 and breaks above the moving averages. That could increase the possibility of the formation of the right shoulder of the inverse H&S pattern.
MATIC/USDT
Polygon formed an inside-day candlestick pattern on March 5, indicating indecision among the bulls and the bears.
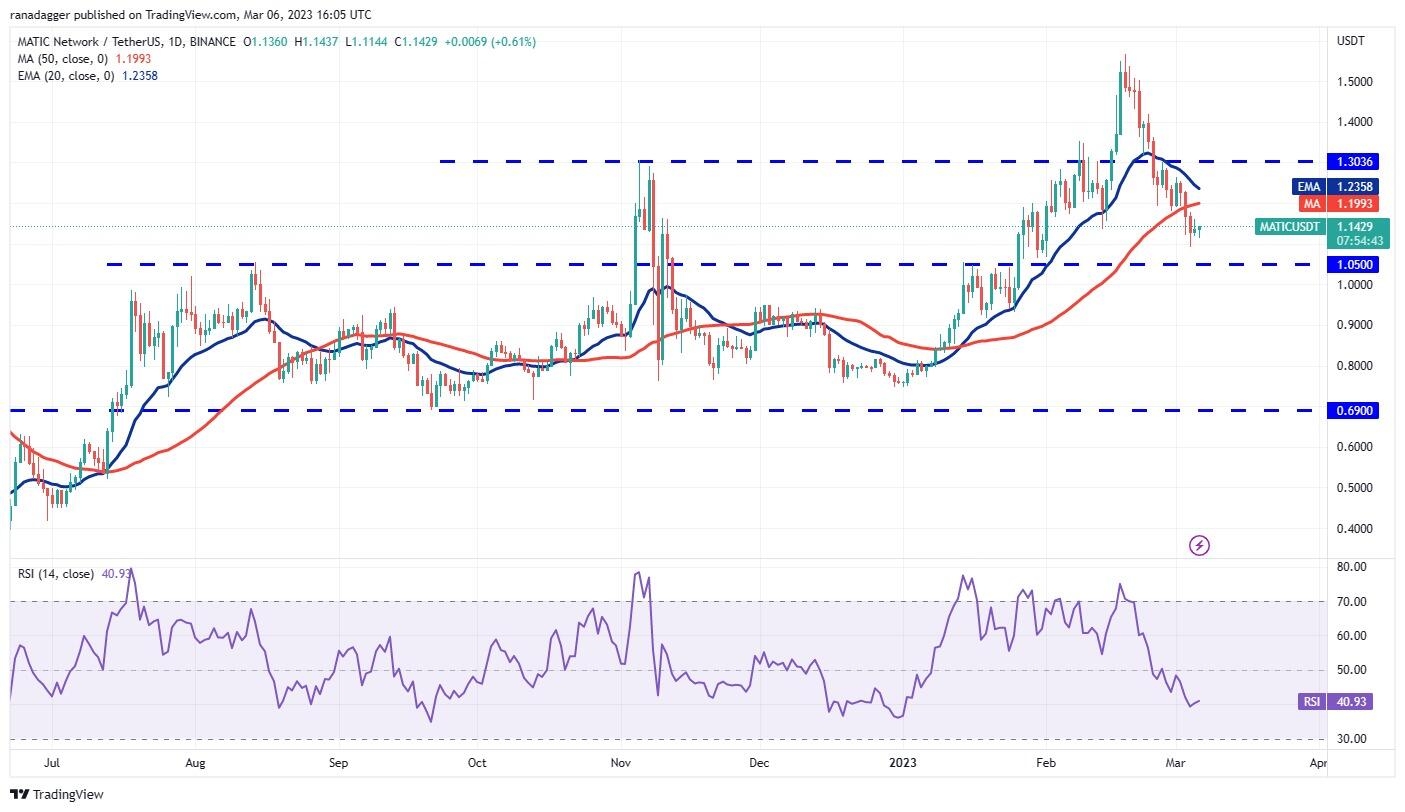
MATIC/USDT daily chart. Source: TradingView
The downsloping 20-day EMA ($1.23) and the RSI below 41 suggest advantage to the bears. The MATIC/USDT pair could drop to the solid support at $1.05. Buyers are expected to defend this level aggressively because a break and close below it may sink the pair to $0.90 and thereafter to $0.69.
Alternatively, if the price turns up from the current level or rebounds off $1.05 with strength, it will indicate demand at lower levels. That may start a relief rally to the 20-day EMA where the bears may again mount a strong defense.
DOGE/USDT
Dogecoin attempted a recovery on March 5 but the long wick on the day’s candlestick indicates selling on rallies.
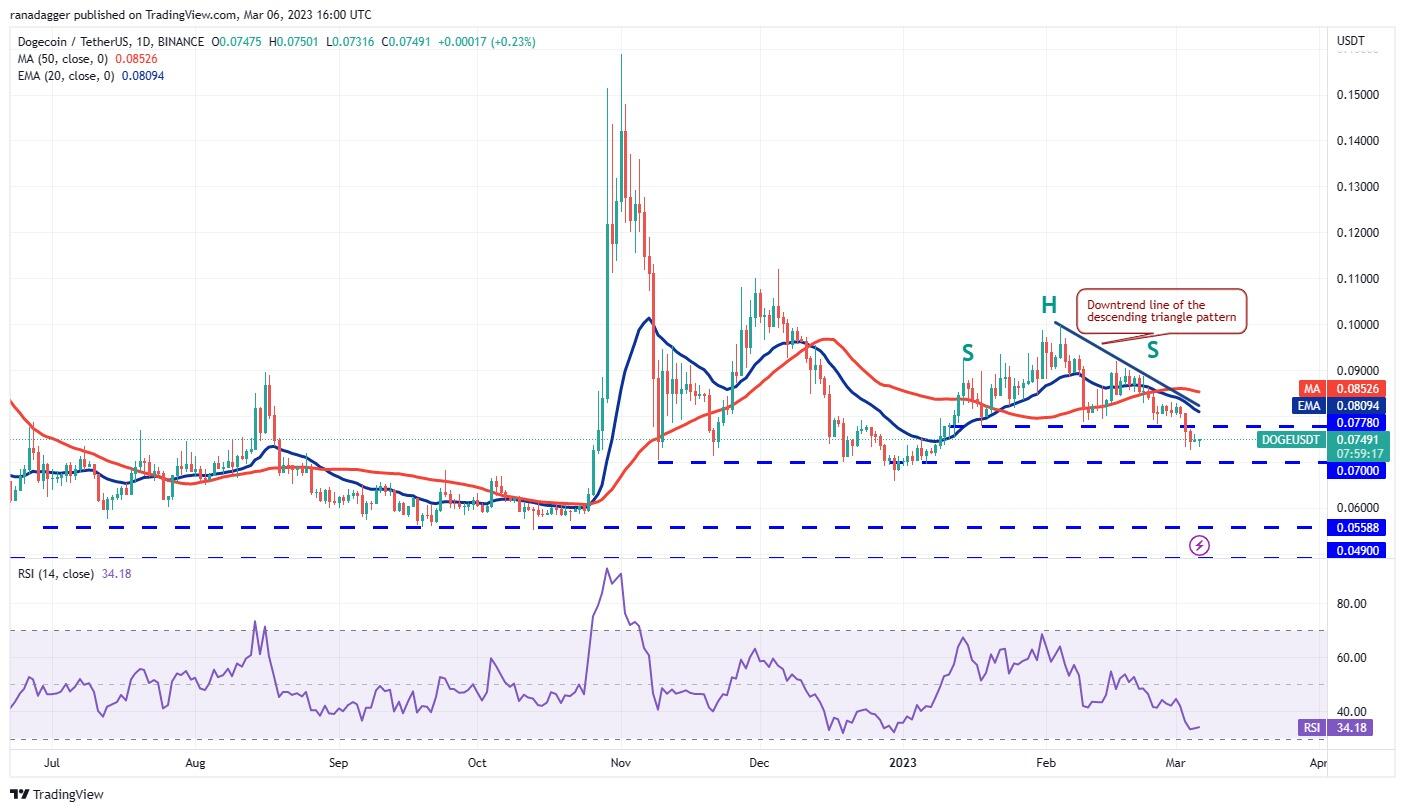
DOGE/USDT daily chart. Source: TradingView
The downsloping 20-day EMA ($0.08) and the RSI near the oversold zone show that bears are in command. The sellers will try to strengthen their position further by yanking the price below the crucial support near $0.07. If this level breaks down, the pair could reach the pattern target of $0.06.
On the way up, the first resistance to watch out for is $0.08. If this level is scaled, the DOGE/USDT pair may start a recovery toward $0.10.
SOL/USDT
The bulls tried to start a recovery in Solana on March 5 but the long wick on the day’s candlestick shows selling near the 20-day EMA ($22.32).
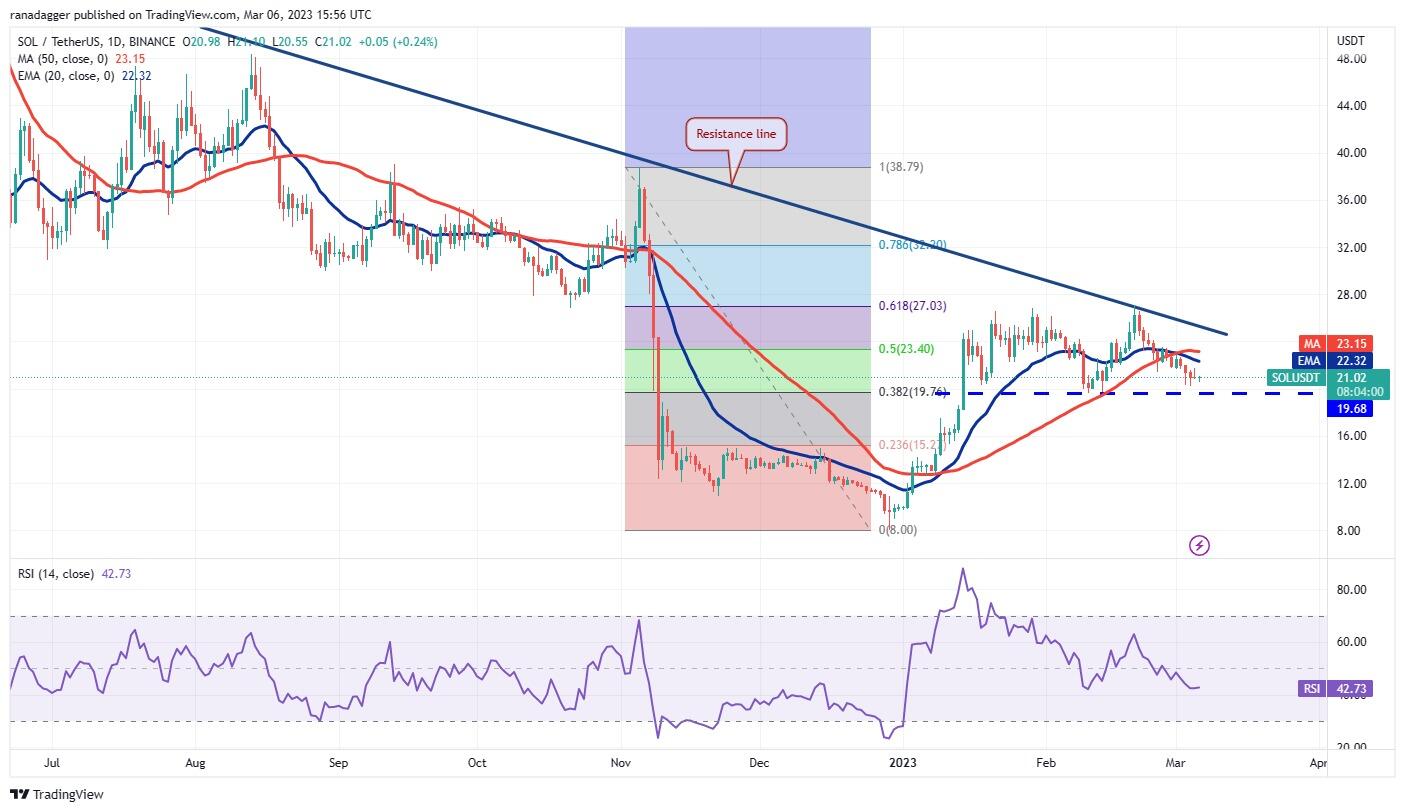
SOL/USDT daily chart. Source: TradingView
The bears will try to pull the price below the strong support near $19.68. If they succeed, the selling may intensify and the SOL/USDT pair could plummet toward the strong support near $15.
On the contrary, if the price rebounds off $19.68, it will suggest accumulation on dips. The bulls will then again try to push the price above the moving averages. If that happens, the pair could rise to the resistance line.
The zone between the resistance line and $27.12 remains the key area to watch out for because a break above it could catapult the pair toward $39.
Author

Cointelegraph Team
Cointelegraph
We are privileged enough to work with the best and brightest in Bitcoin.


