- MATIC price has yet to show a bullish countertrend rally since breaching the parallel trend channel.
- Polygon price has fallen in free-fall fashion, a typical catalyst for a long range-bound consolidations.
- Invalidation of the bearish downslide is a breach above $0.73.
MATIC Price has two scenarios in place. Traders/investors should consider other digital currencies and let the technicals of MATIC play out further.
MATIC price is in an in-between zone.
MATIC price has fallen in nearly a straight shot since January’s all-time high at $2.92. The bulls were likely expecting a countertrend rally to ensue by now as the scaling-solution token has fallen below the breached parallel trend channel. Unfortunately, classical-style trading methodologies like trend channel retests have not worked on this market yet.
Polygon’s MATIC price continues to fall “penny from Eiffel” style to no avail as the bears have the $0.45 level cornered. The bulls have yet to hurdle through the previous 2-week opening candle, nor have they printed a bullish candle of equal or more value to the largest candle within the bearish decline. If market conditions persist, the bears could target $0.20 with little to no resistance.
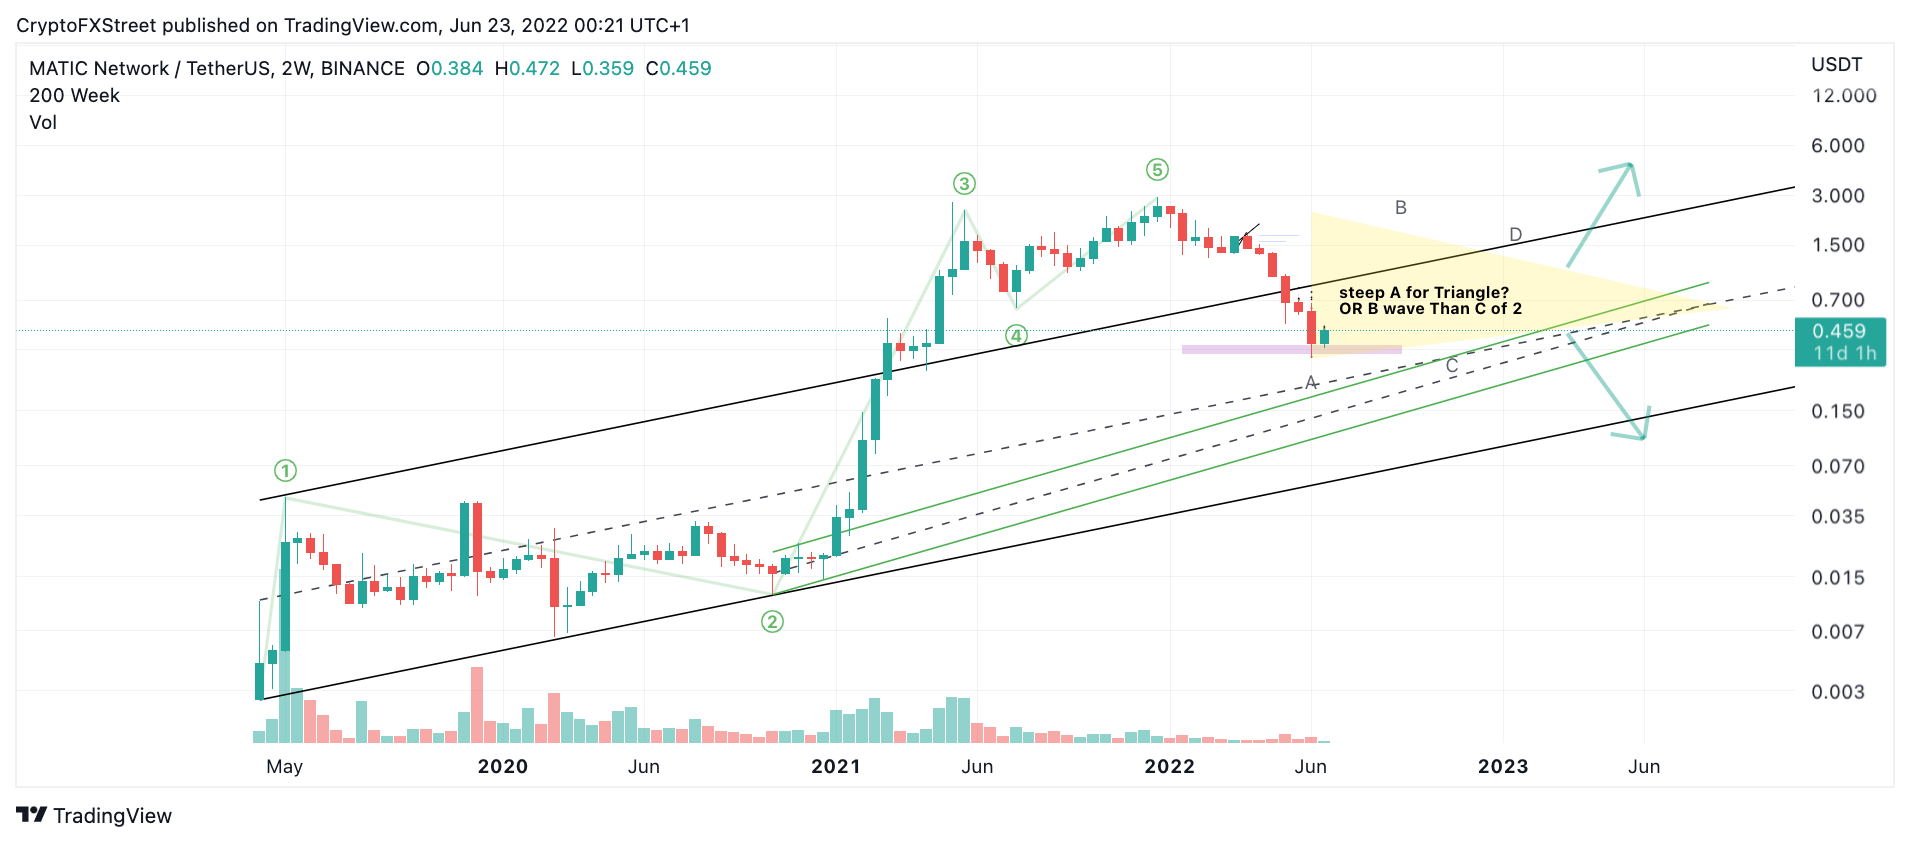
MATIC/USDT 2-Week Chart
There is however, the tapering volume pattern, which suggests the long-term count for Polygon price is still bullish. Still, deciphering the next 4-6 weeks out will be challenging, even for the best academic Elliot Wave practitioners out there.
To keep it simple, forget about the academics for now and trade a different chart. In a few weeks, MATIC price will depict more evidence of where it wants to go. The steep decline will either be a part of a corrective structure or the first macro wave of the bear market. Both scenarios can only be confirmed in retrospect.
In the short term, a break above $0.73 could end the current downtrend for traders looking to take a risk. If the bulls breach this level, a rally towards $$1.20 could occur, resulting in a 150% increase from the current MATIC price.
Information on these pages contains forward-looking statements that involve risks and uncertainties. Markets and instruments profiled on this page are for informational purposes only and should not in any way come across as a recommendation to buy or sell in these assets. You should do your own thorough research before making any investment decisions. FXStreet does not in any way guarantee that this information is free from mistakes, errors, or material misstatements. It also does not guarantee that this information is of a timely nature. Investing in Open Markets involves a great deal of risk, including the loss of all or a portion of your investment, as well as emotional distress. All risks, losses and costs associated with investing, including total loss of principal, are your responsibility. The views and opinions expressed in this article are those of the authors and do not necessarily reflect the official policy or position of FXStreet nor its advertisers. The author will not be held responsible for information that is found at the end of links posted on this page.
If not otherwise explicitly mentioned in the body of the article, at the time of writing, the author has no position in any stock mentioned in this article and no business relationship with any company mentioned. The author has not received compensation for writing this article, other than from FXStreet.
FXStreet and the author do not provide personalized recommendations. The author makes no representations as to the accuracy, completeness, or suitability of this information. FXStreet and the author will not be liable for any errors, omissions or any losses, injuries or damages arising from this information and its display or use. Errors and omissions excepted.
The author and FXStreet are not registered investment advisors and nothing in this article is intended to be investment advice.
Recommended Content
Editors’ Picks
Ripple's move above this key level could trigger nearly 50% rally for XRP
Ripple has overcome a critical resistance level and flipped into a support floor on the weekly time frame. This development happened while XRP tightly consolidated for roughly 250 days. Investors can expect XRP to kickstart a massive rally.
Optimism price outlook with nearly $90 million worth of OP tokens flooding markets on Friday
Optimism volatility has shrunk in the ours leading to the network’s cliff unlock. It joins the likes of dYdX and Sui, which have similar events on their calendars. As token unlocks are often considered bearish catalysts, investors should brace for a reaction after the event.
Top 3 Price Prediction Bitcoin, Ethereum, Ripple: Retail watches from the sidelines with a bias for shorts
Bitcoin could clear $73,777 peak as BTC bulls resurface. Ethereum might fall 10% before next leg up as ETH RSI teases with sell signal. XRP could lose $0.6000 threshold as Ripple bulls fail to show up.
Jito price could hit $6 as JTO coils up inside this bullish pattern
Jito price action shows a potential cup and handle formation. Based on theoretical measurement rules, a successful breakout could yield a 56% rally to $6.0. A breakdown of the $3.86 support level would create a lower low for JTO and invalidate the bullish thesis.
Bitcoin: BTC may have recovered, but is it out of the woods?
Bitcoin’s (BTC) upward momentum has shown a significant decline for the past two weeks or so. This development led to a bearish signal on the weekly and an uncertain outlook on the monthly.