Polkadot Price Analysis: DOT's new bullish wave might have to wait
- Polkadot broke above the critical channel resistance amid positive fundamentals.
- DOT may enter the downside correction before the growth is resumed.

Polkadot (DOT) is the 8th largest digital currency with a current market capitalization of $4 billion and an average daily trading volume of $900 million. The coin has entered the top-10 following the redenomination in August 2020 that resulted in creating a new DOT, 100x smaller than the old DOT. The coin is most actively traded against USDT on Binance, OKEx, and Huobi Global.
At the time of writing, DOT/USD is changing hands at $4.78, off the intraday high of $4.95. Despite the retreat, the coin is still nearly 10% higher from this time on Monday, October 26, and over 20% higher on a week-to-week basis.
Polkadot is coming to BitMEX
As a project that serves as a link between numerous independent blockchains, joining them into a global ecosystem, Polkadot has enjoyed a steady positive news flow. Thus the trading platform for cryptocurrency derivatives, BitMEX, recently announced the upcoming launch of Polkadot underlying quanto futures contracts.
The new trading instrument will go live on October 30, along with futures on Binance Coin (BNB) and yEarn Finance (YFI). Market players will be able to trade DOT futures with a maximum leverage of 25x.
The main feature of quanto futures is that they are held in one currency and calculated in another. In this case, the contracts have a fixed Bitcoin multiplier, meaning that traders can operate a coin without needing to hold multiple altcoins or USDT. As it is explained in BitMEX's blog post, "traders post margin in XBT, and earn or lose XBT as the future's price changes."
The BitMEX move is another signal of Polkadot's growing popularity. This blockchain has attracted many developers and became the best-performing blockchain in terms of developer activity, outpacing TRON and EOS.
In November, the project is expected to start Alpha testing of its wrapped Bitcoin, PolkaBTC, that will go live at the beginning of 2021.
DOT's bulls should proceed with caution
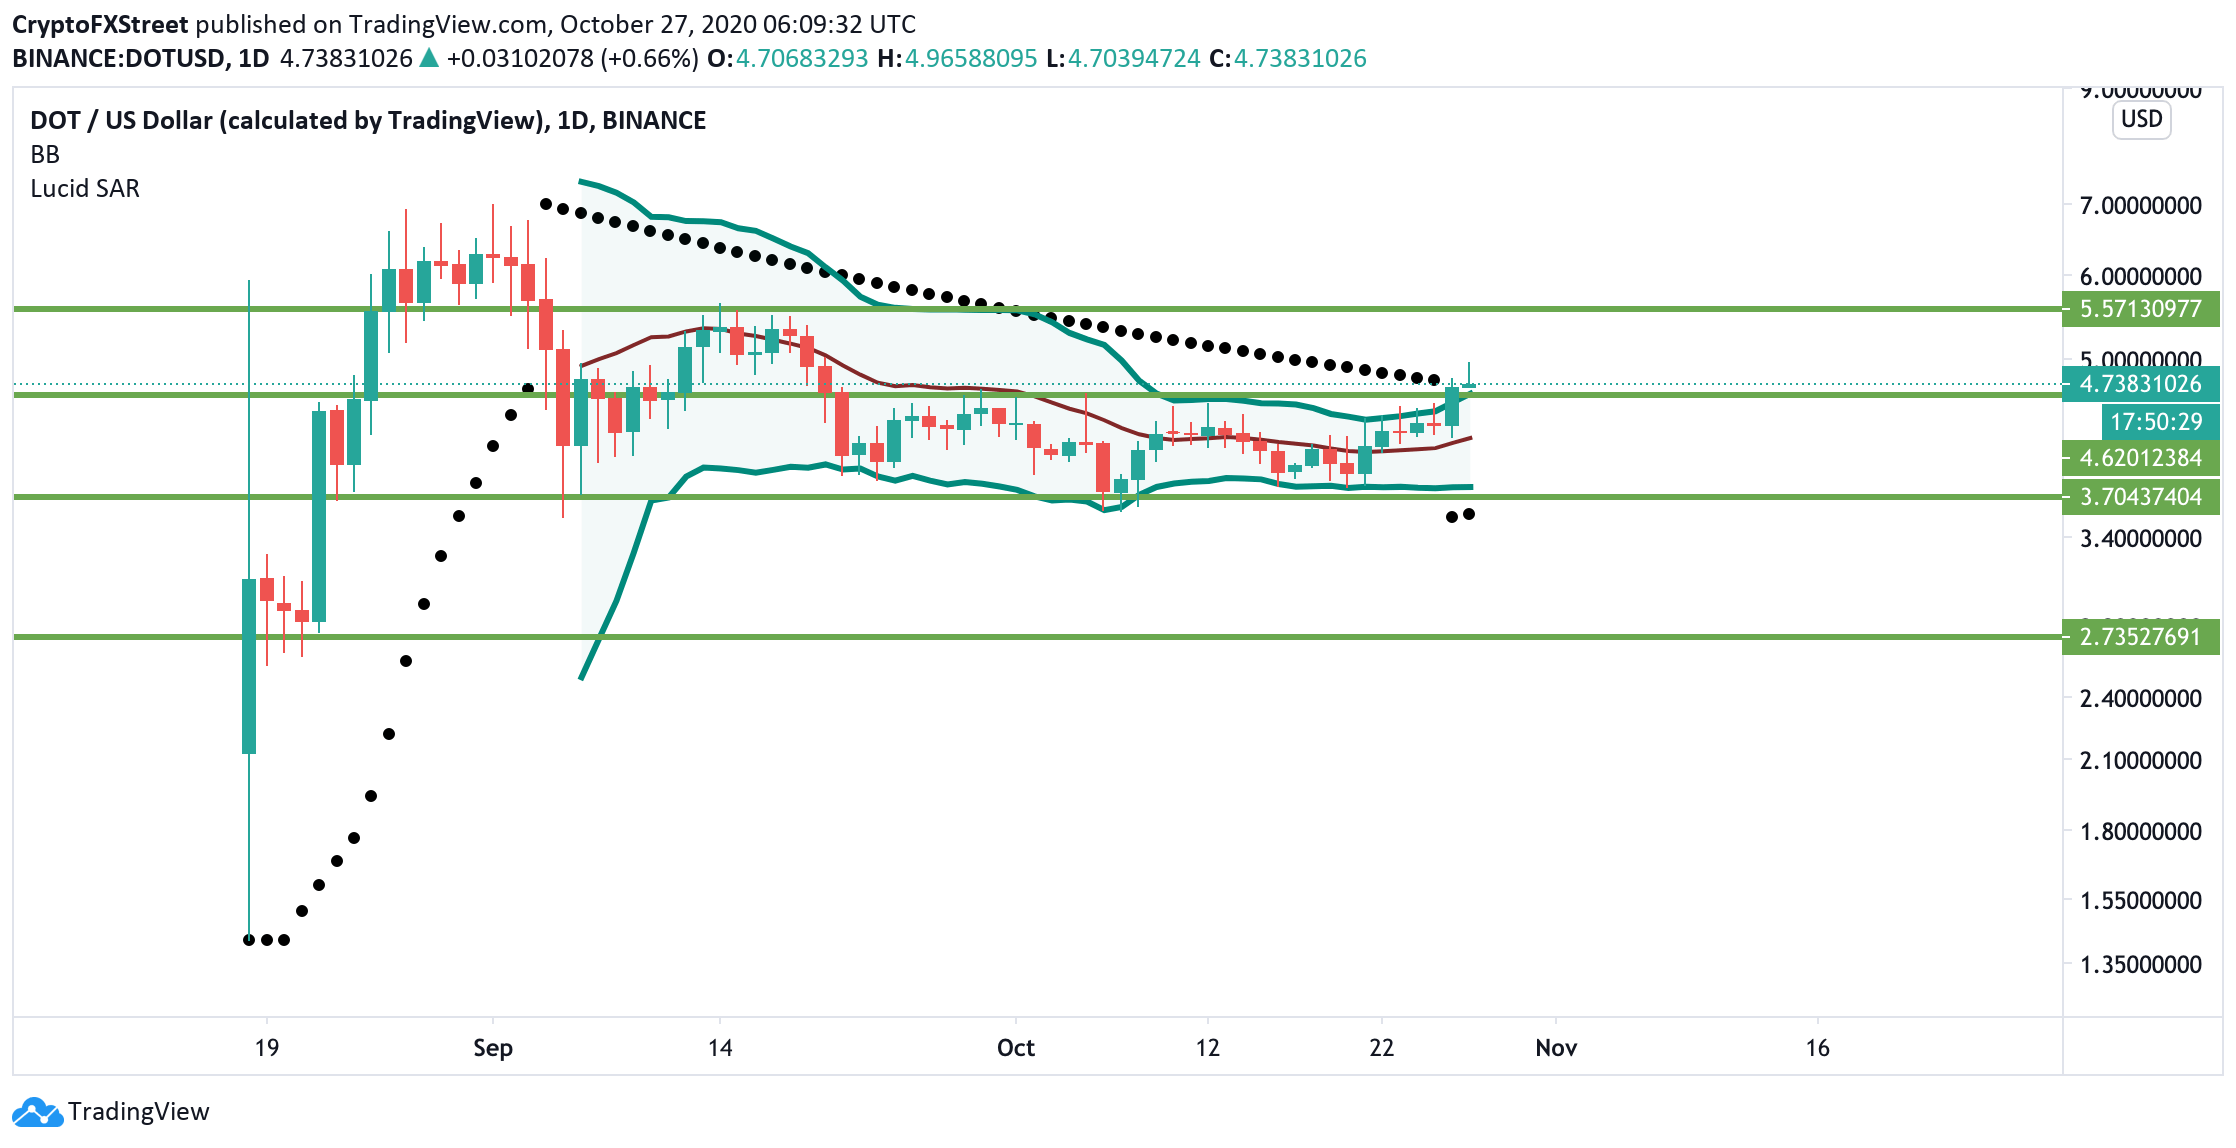
From the technical point of view, DOT/USD has broken the channel resistance of $4.6 and hit the highest level in over a month at $4.95 amid a sharp volatility spike. The coin jumped above the Bollinger Band's upper line on a daily chart, signalling the creation of a new trend. A Parabolic SAR indicator swing also confirms the bullish reversal.
If this upside momentum is sustained, we may see an extended upside movement towards the next resistance of $5.5 that stopped the recovery in the middle of September.
DOT/USD daily chart
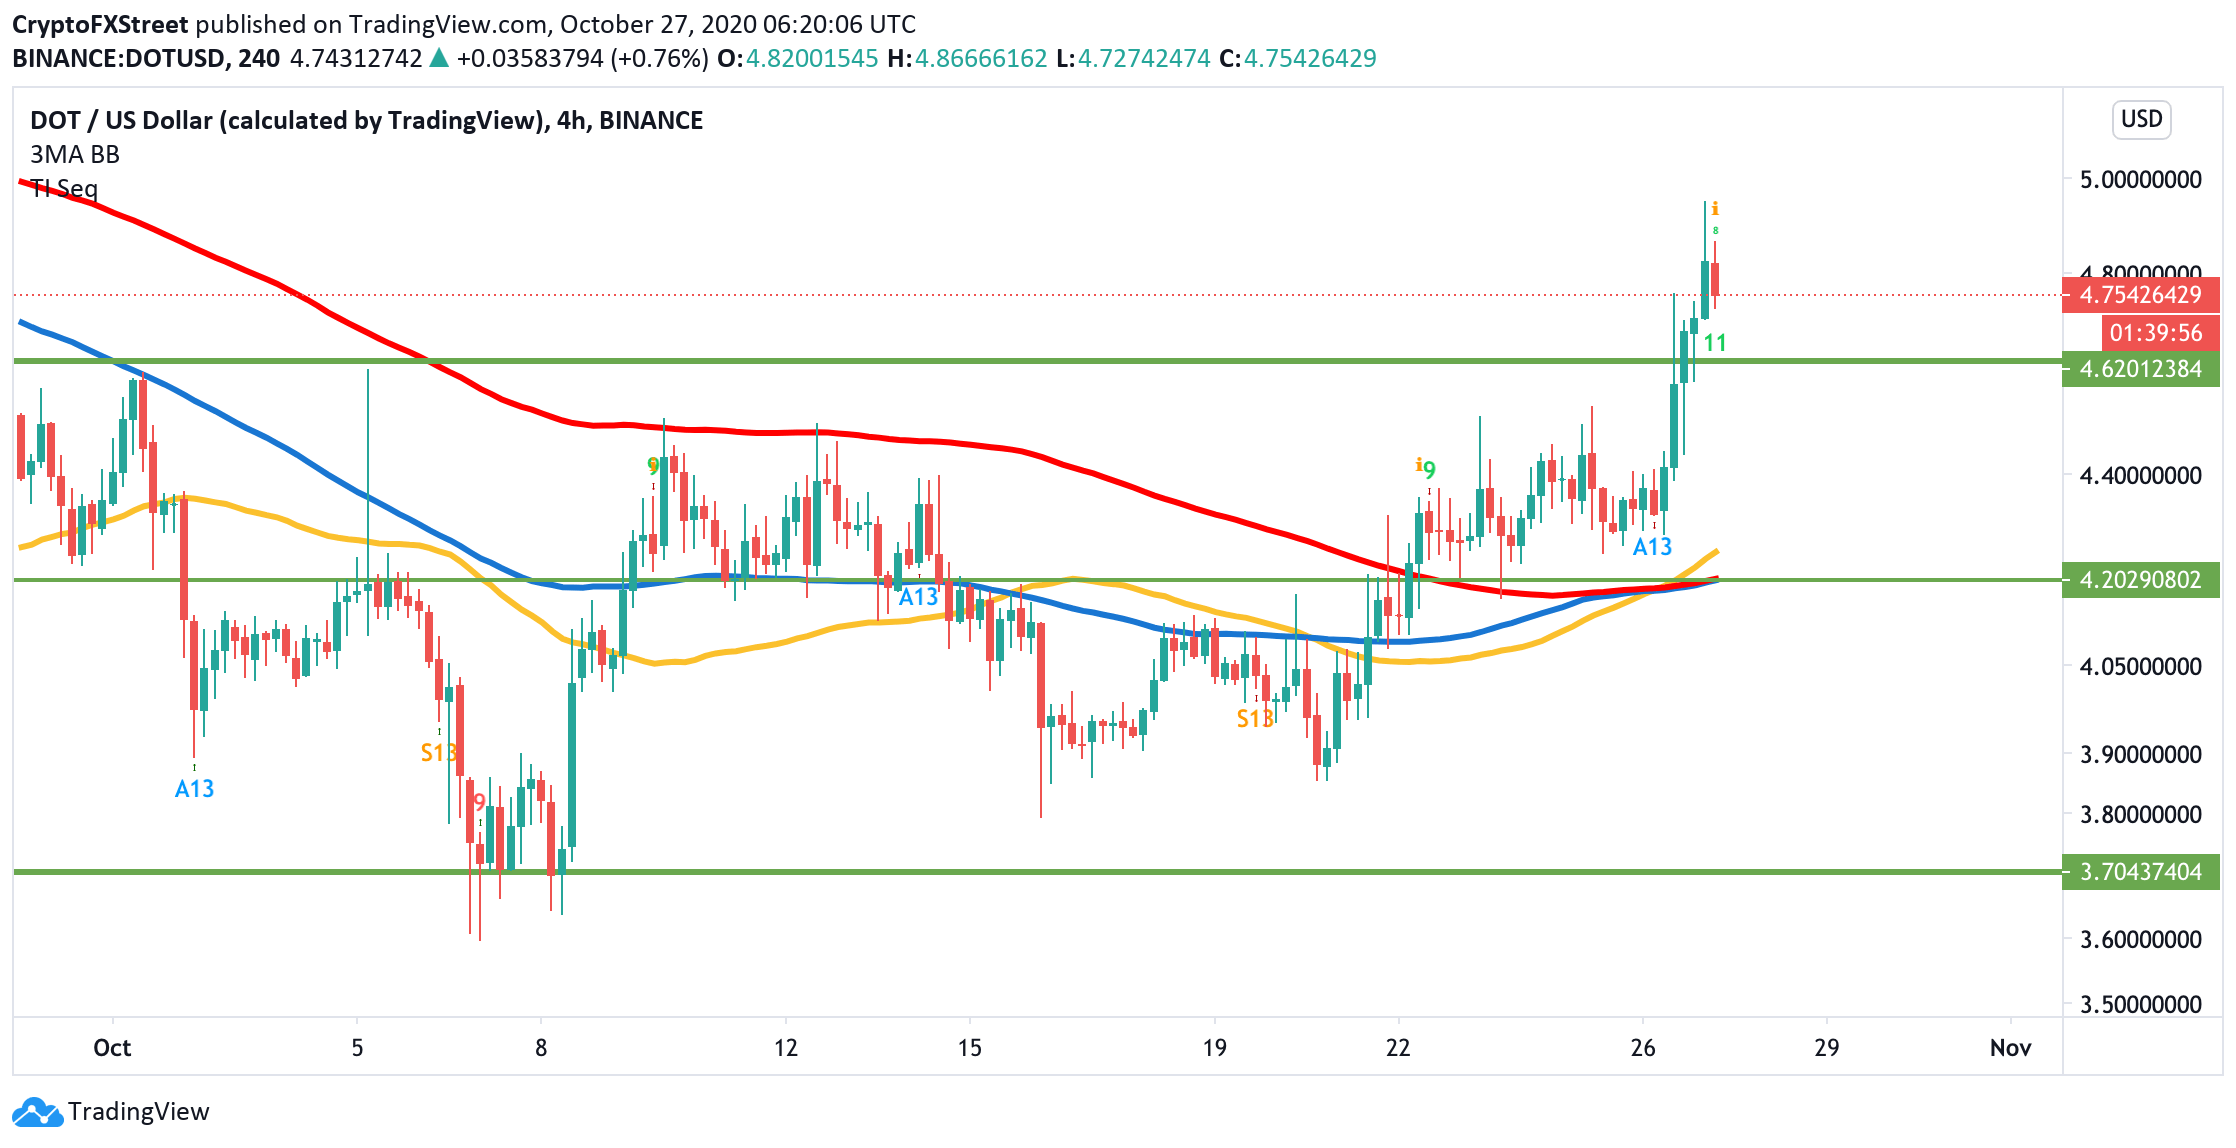
Meanwhile, the intraday picture implies that traders might need to be extra cautious as the TD Sequential indicator of the 4-hour chart has printed a red-eight candlestick. This is an early signal of the potential downside correction that may take the price back below the broken channel resistance at $4.6 towards the next support created by a combination of moving averages at $4.2. It's worth mentioning that, right at that point, the 50 and 200 Exponential Moving Averages have drawn a golden cross pattern, which might reinforce the bullish case presented in the DOT daily chart.
If bears were able to take DOT/USD below that meaningful support level, the sell-off will likely gain traction with the next focus on $3.7. This area stopped the decline on numerous occasions since the beginning of September. If it is broken, a psychological $3 will come into focus.
DOT/USD 4-hour chart
The key levels to watch
From the long-term perspective, DOT is well-positioned to continue growth with the next focus on $5.5. However, the price may retreat to $4.6 and $4.2 support areas before the growth is resumed. A sustainable move below $4.2 will invalidate the bullish scenario and attract more sellers to the market.
Author

Tanya Abrosimova
Independent Analyst


