Pump.fun Price Forecast: PUMP retreats despite DEX volume, investor demand surge
- Pump.fun is down 7% on Wednesday after an eight-day rally, failing to break above the 50-day EMA.
- Pump.fun’s daily DEX volume crossed over $2 billion on Tuesday, suggesting a rebound in meme coin activity on Solana.
- On-chain data reveals an accumulation spree among mid-tier holders, fueling PUMP’s recent recovery.

Pump.fun (PUMP) trades in the red on Wednesday after eight consecutive days of uptrend, facing intense overhead pressure from the 50-day Exponential Moving Average (EMA). The Solana-based meme coin launchpad set a record for daily Decentralized Exchange (DEX) volume on Tuesday, suggesting a resurgence in user demand. Additionally, an increase in mid-size wallet holdings fueled the PUMP recovery run, signaling renewed market confidence.
Still, the short-term technical outlook remains bearish, as PUMP reverses from the 50-day EMA, a crucial dynamic resistance.
Renewed interest in meme coins surges DEX volume
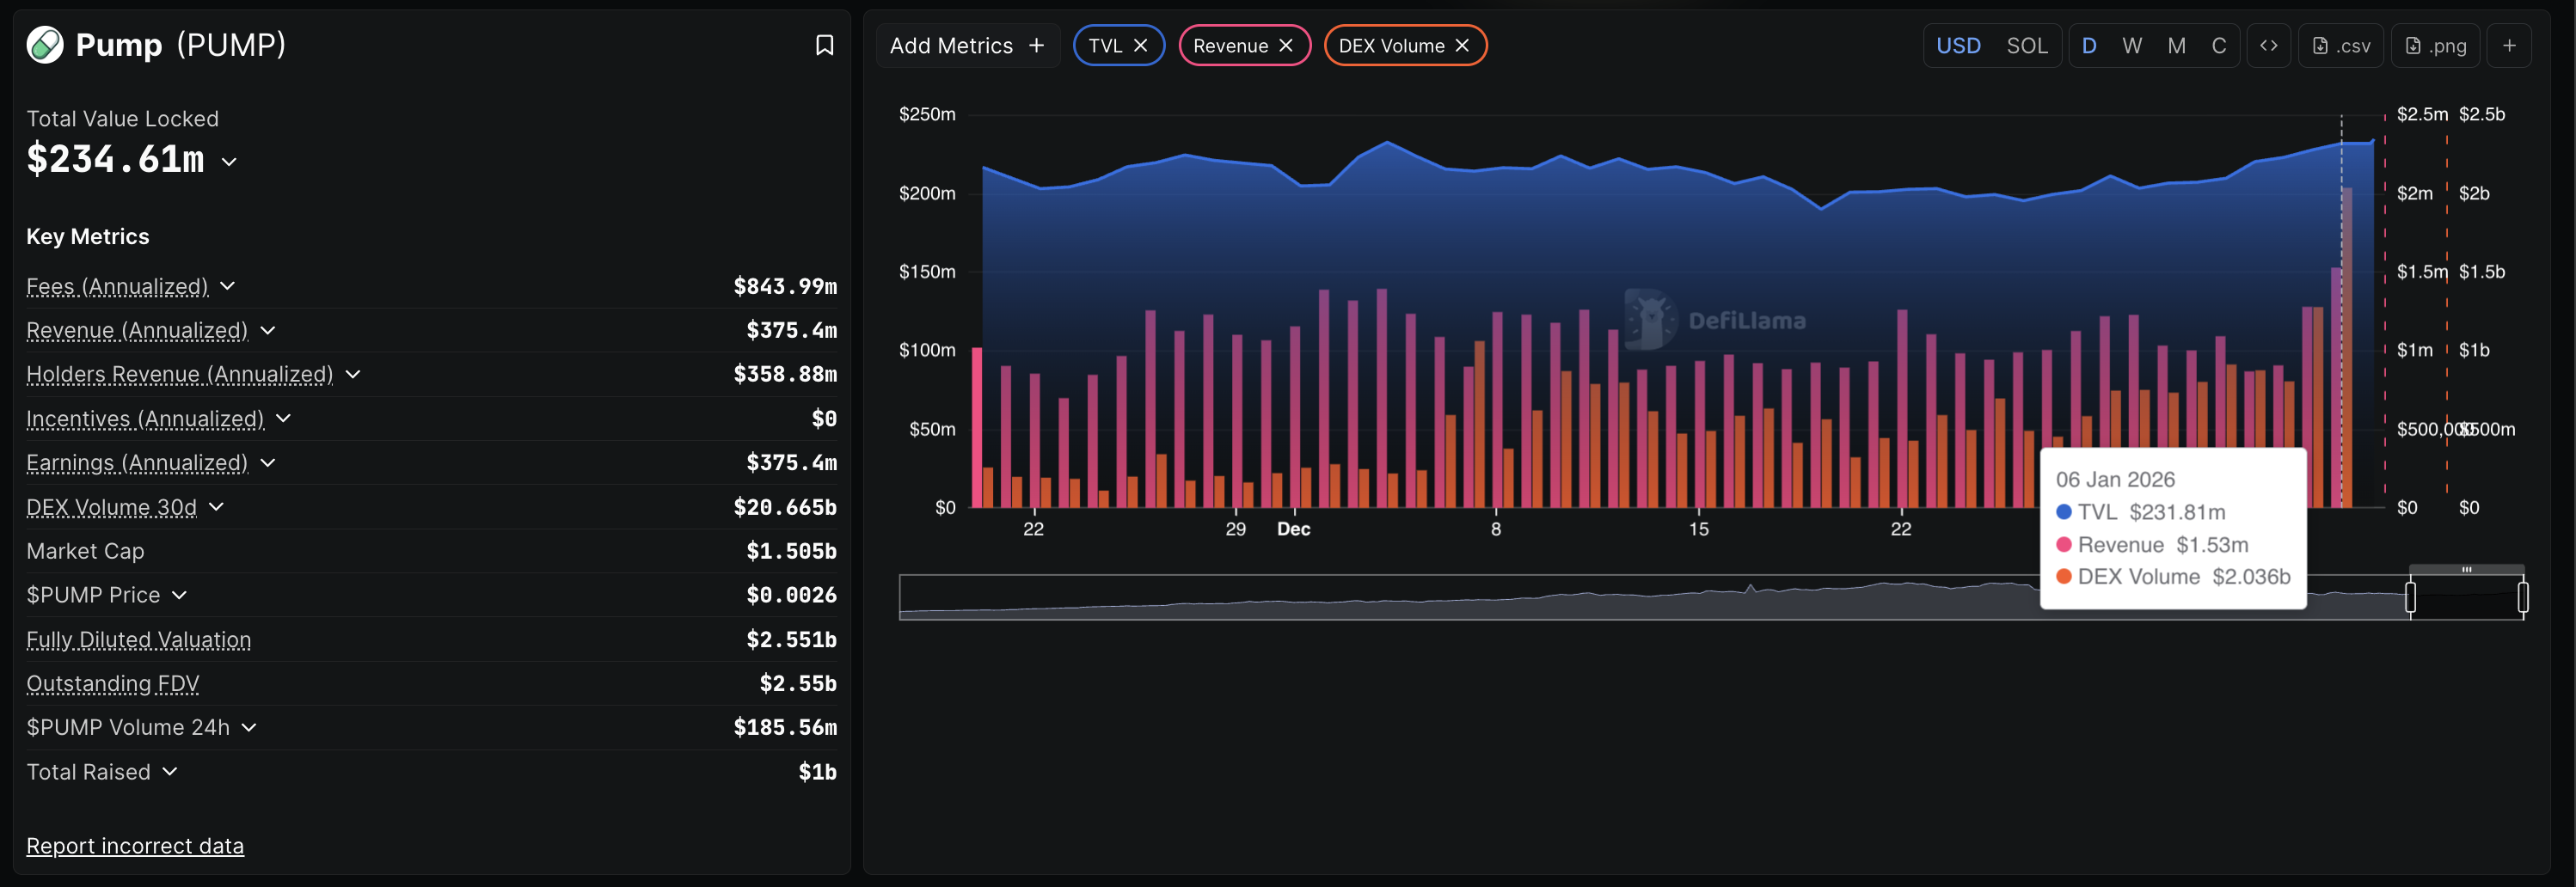
Pump.fun DEX volume refers to the total volume of tokens traded on the platform, which are typically created on this Solana-based meme coin launchpad. DeFiLlama data shows a record-high DEX volume of $2.036 billion on Tuesday, suggesting a boost in user demand for meme coins on Pump.fun.
Additionally, the Total Value Locked (TVL) on Pump.fun – value of assets deposited on the platform – stands at $234.61 million on Wednesday, marking a 30-day high. All of these metrics suggest a renewed demand in the Solana meme coins market.
Mid-size investors demand spike powers PUMP rally
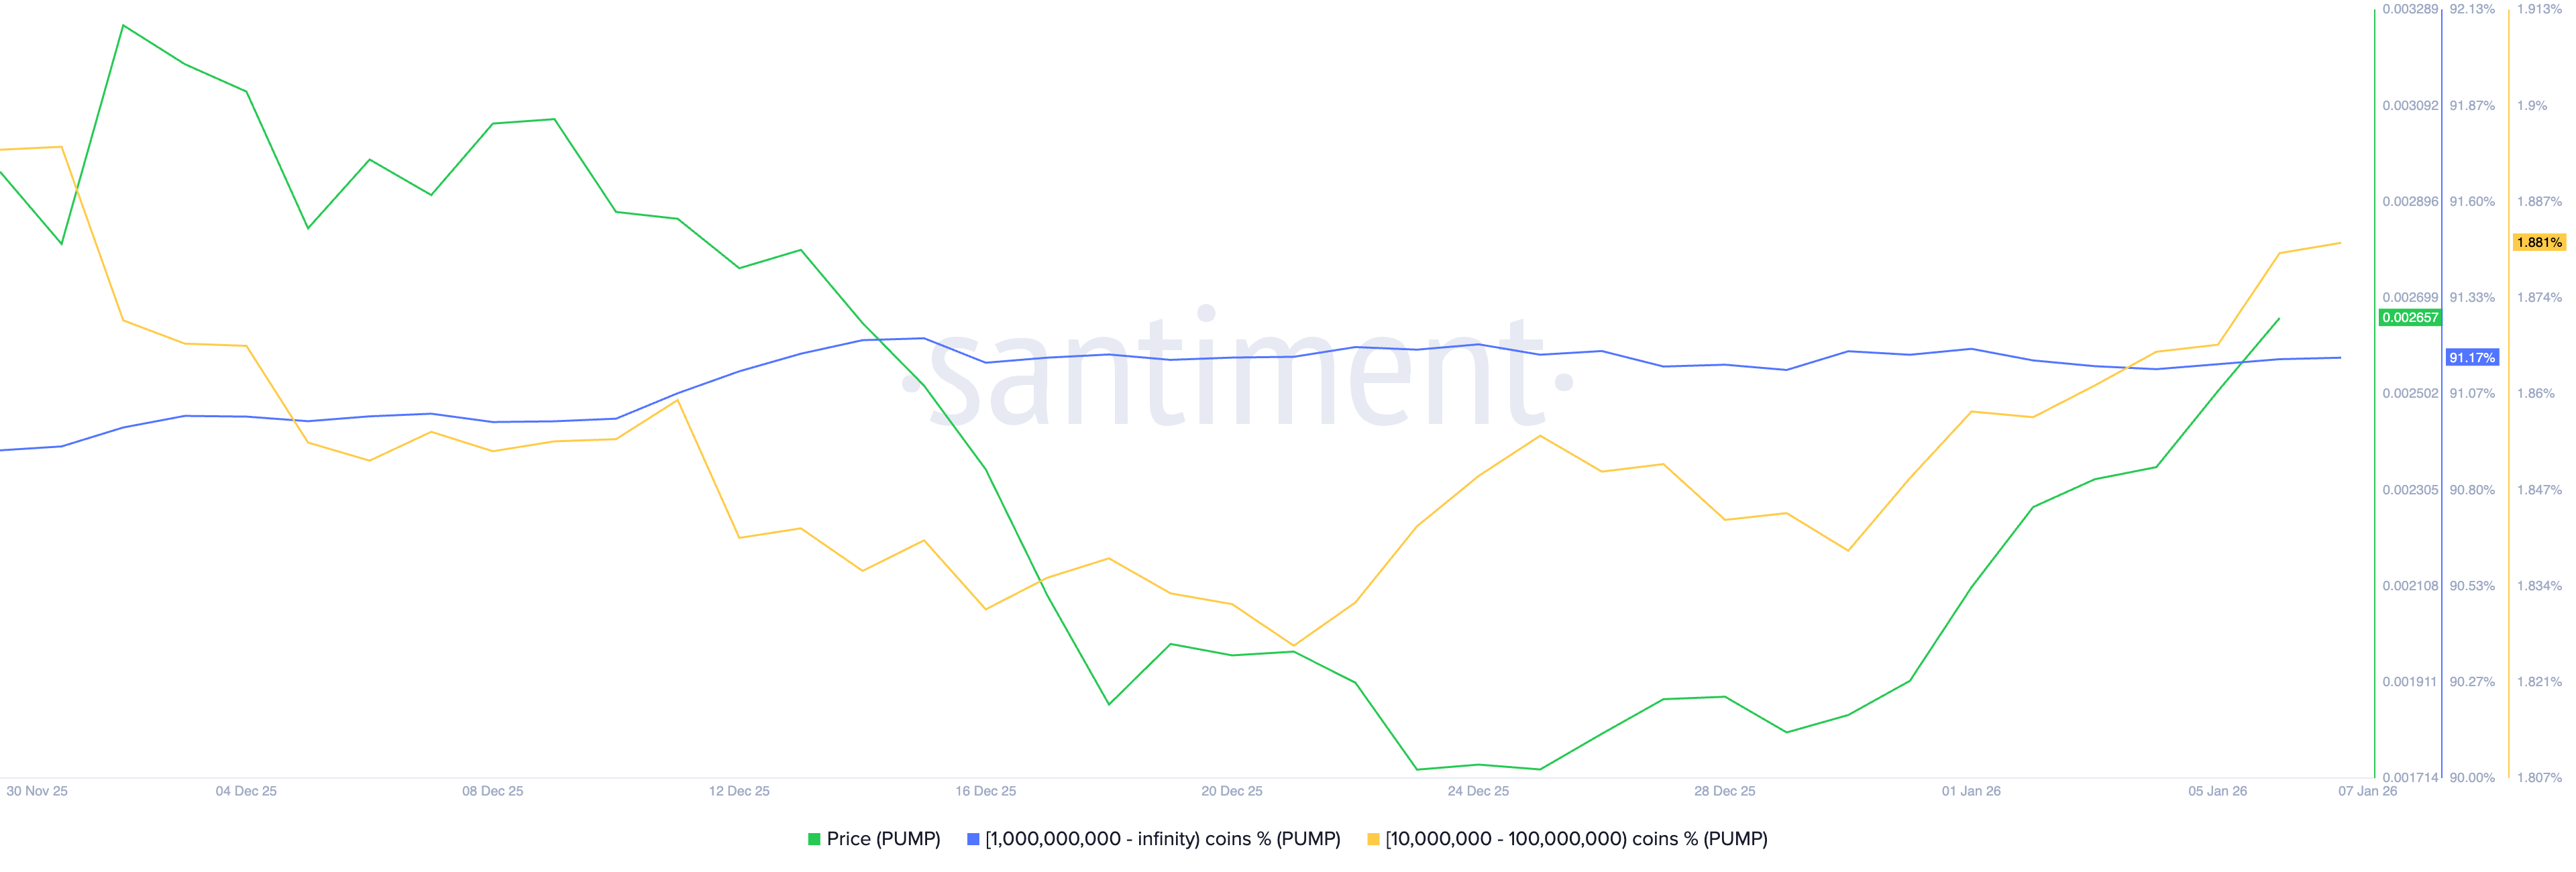
On-chain data shows that large-wallet investors hold steady as increased activity from mid-sized wallets drives the PUMP price. According to Santiment, holders with over 1 billion PUMP tokens hold over 91% of the on-chain supply.
On the other hand, investors with 10 million to 100 million PUMP have increased their exposure to 1.88%, from 1.83% on December 21. Notably, the increase in the holding of these cohorts roughly leads the PUMP price surge, suggesting a direct correlation.
Technical outlook: Could PUMP exceed the 50-day EMA?
Pump.fun drops over 7% by press time on Wednesday, facing intense supply pressure from the 50-day EMA at $0.002640. The intraday pullback marks a halt in the breakout rally of a resistance trendline on the daily chart.
If PUMP extends this pullback, it could test the broken trendline near the $0.002000 psychological mark.
Still, the Supertrend indicator reflects a largely upward trend, retaining its buy signal from Saturday.
The Relative Strength Index (RSI) is at 55 on the daily chart, retracing towards the halfway line as buying pressure declines. Additionally, the Moving Average Convergence Divergence (MACD) indicator remains in an upward trend, but a decrease in the green histogram bars indicates a drop in bullish momentum.
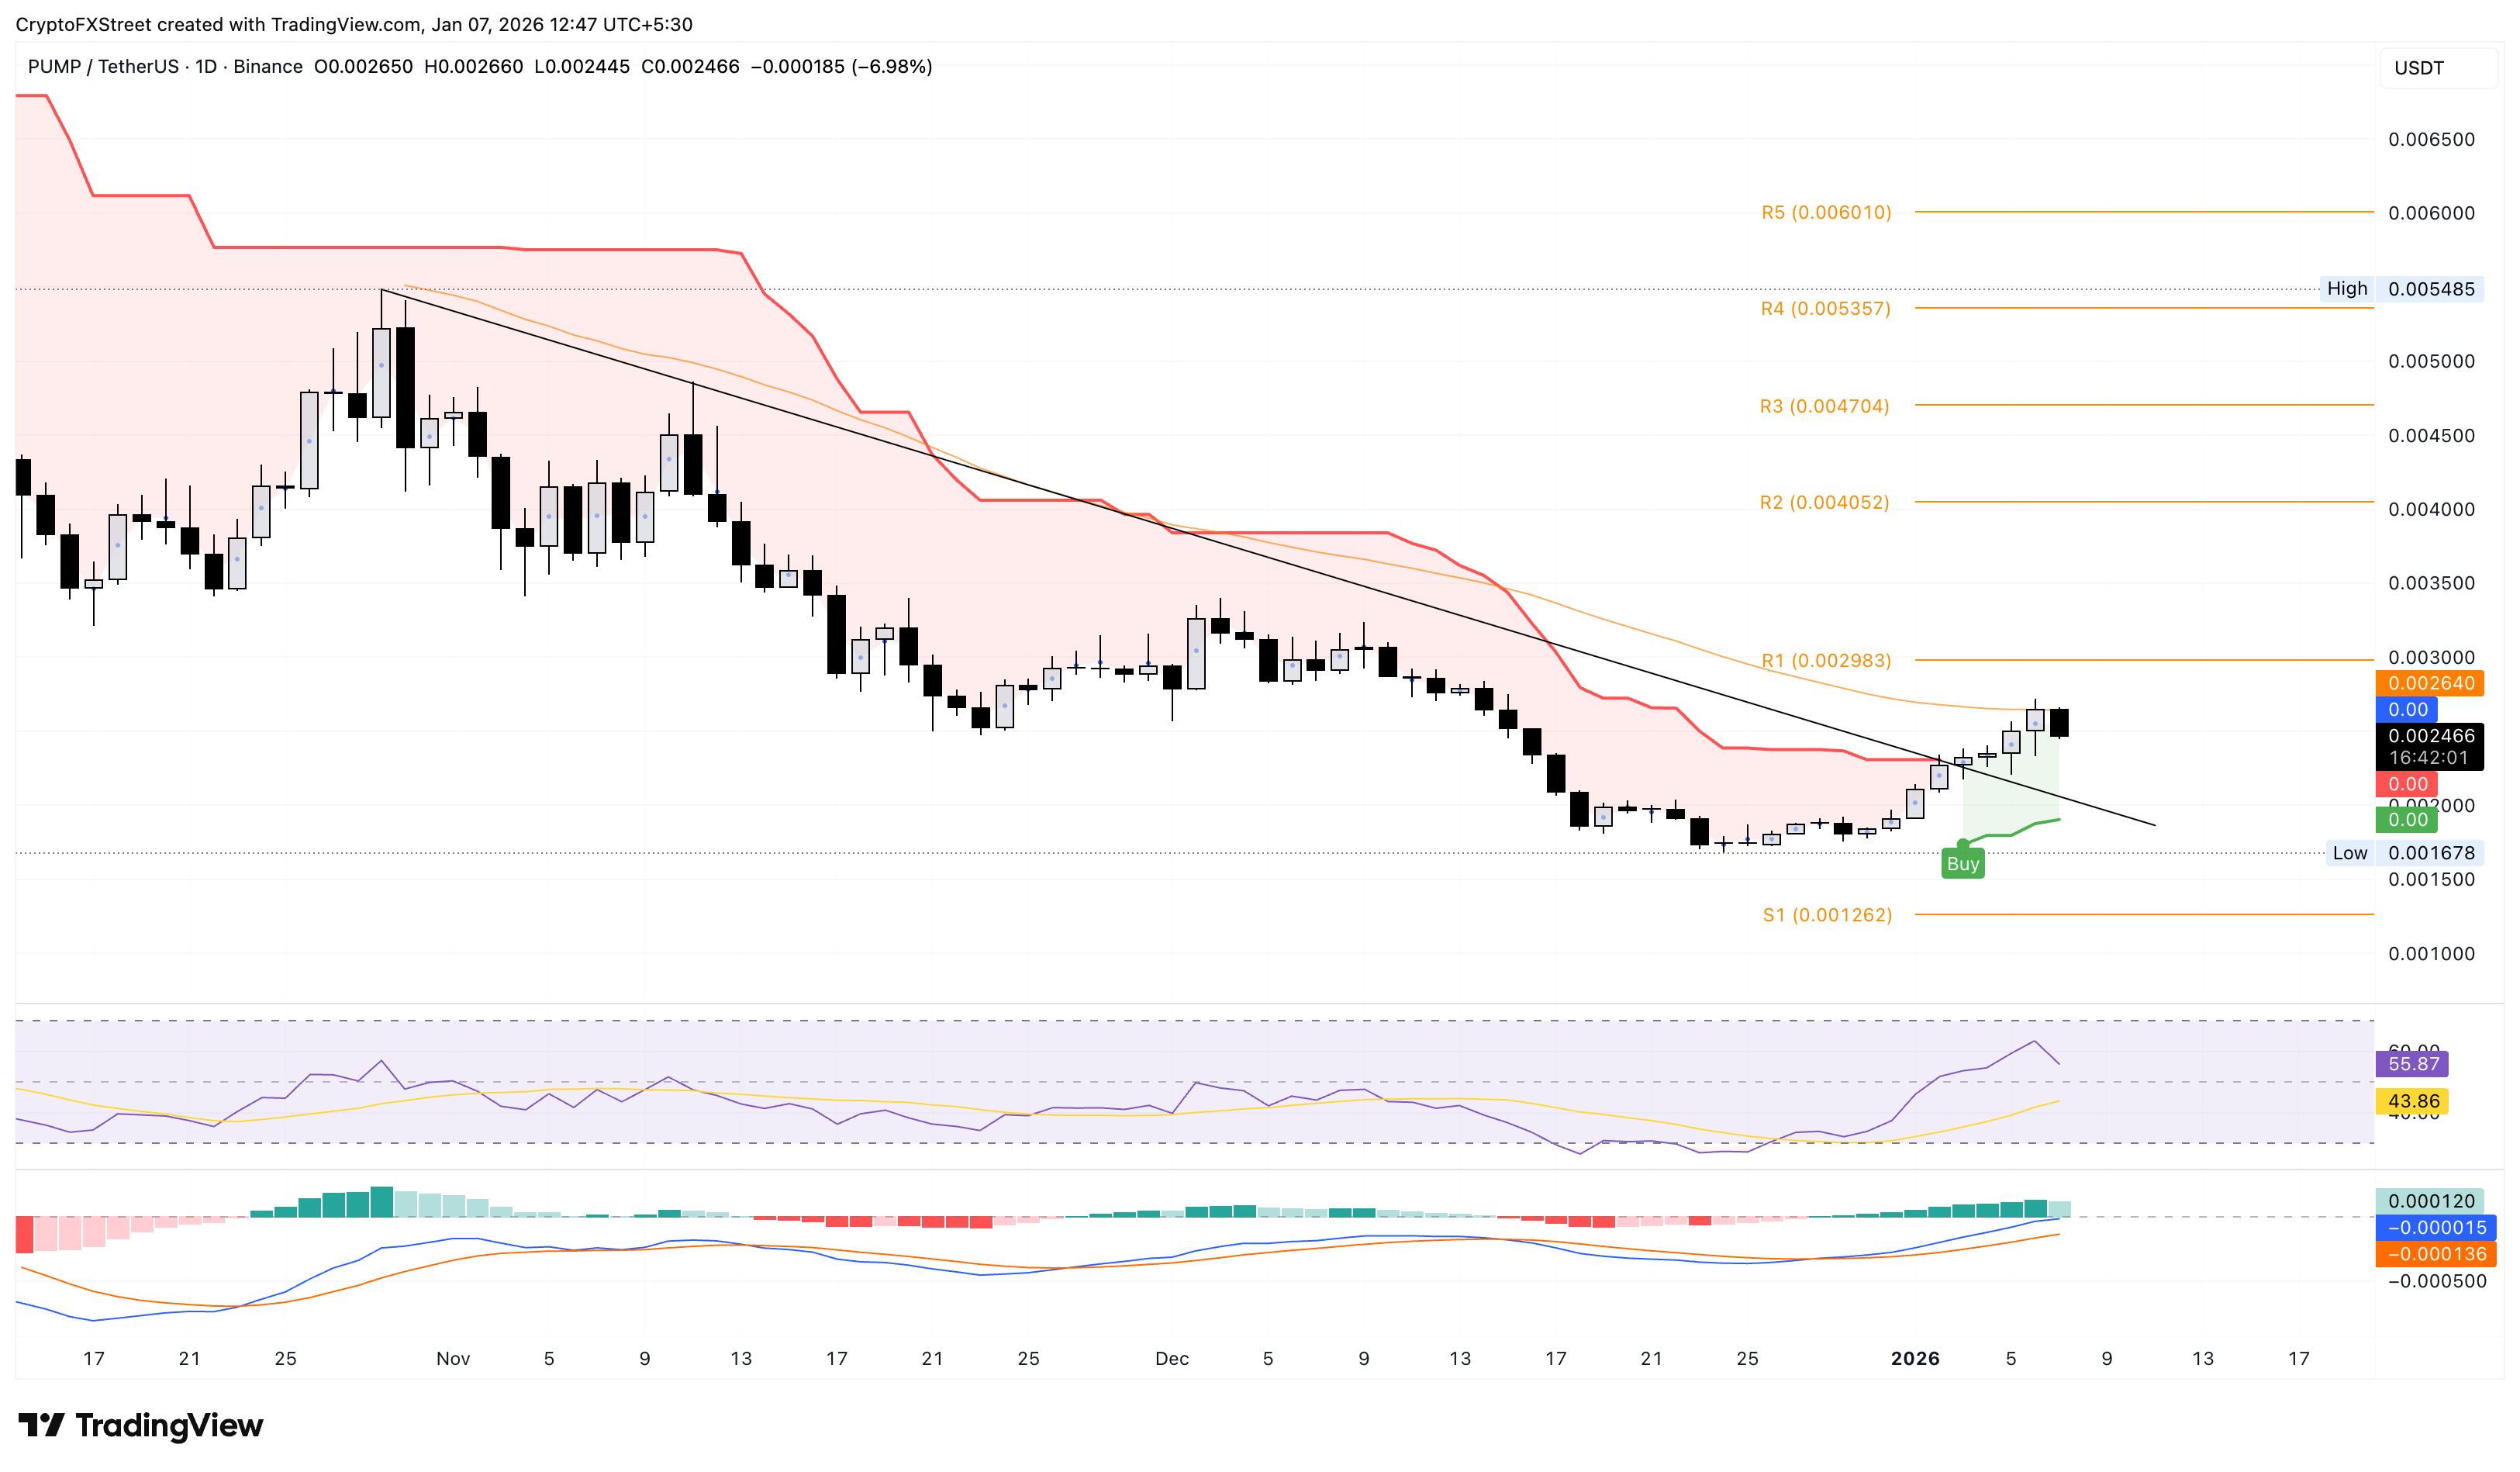
To reinstate recovery, PUMP should surpass the 50-day EMA at $0.002640, potentially targeting the R1 Pivot Point at $0.002983, close to the $0.003000 round figure.
Author

Vishal Dixit
FXStreet
Vishal Dixit holds a B.Sc. in Chemistry from Wilson College but found his true calling in the world of crypto.


