Polkadot price will jump by 20% once DOT moves above this support level
- Polkadot has made a solid run higher, taking out a few critical price targets.
- Today DOT is dipping slightly lower, which is expected after the rally from yesterday.
- Buyers who took profit have a perfect entry to add or get in again for the next leg higher.

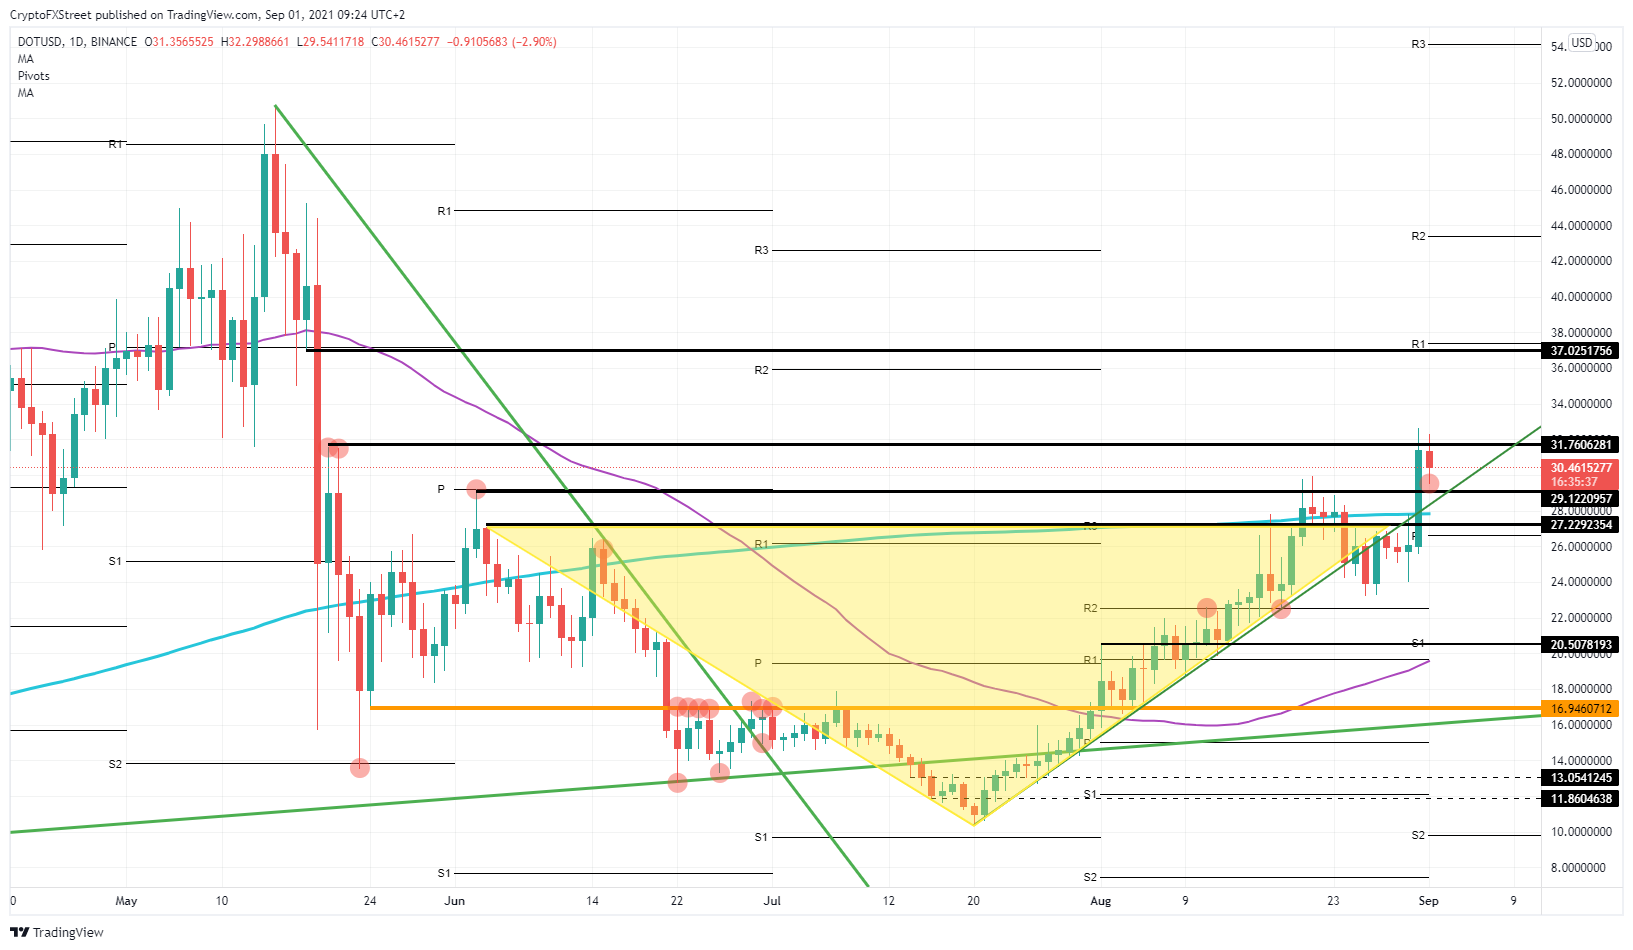
Polkadot (DOT) made a nice move up on August 31, taking out a few vital profit levels. The first to break was $29.12, originating from June 3. That level also fell in line with the pivot of June, making it a double reason for interest. On August 20 and 21, buyers already tried to claim this level but failed. Price action faded further down after that attempt.
Polkadot price has more room to go if buyers get in at the right point
The pop higher on August 31 easily took out that $29.12 and even tried to claim $31.76, which was up on our chart because of the double top formation on May 20 and 21. Not having been tested since then, but it is still a level to be aware of. Once again, the same sort of pattern is emerging on the chart. Buyers tried to reclaim but failed, and DOT price looks to be fading again. That does not need to be a bad thing for buyers though.
A cooldown after a 27% move in just one day would wear anybody down. Buyers already have locked in some or all their profit, so this kind of correction and paring back of gains is normal.
DOT/USD daily chart
It will be necessary now that price action can remain above or rebounce based on three indicators on the chart. The first level that should turn resistance into support is $29.12. If that level does not hold, just below there is the green ascending trend line around $29. Last but not least, if that would not do the trick, there is still the 200-day Simple Moving Average (SMA) at $28 as support.
Sellers who are trying to short DOT from $31.76 will need to keep the levels mentioned above in mind as well, thus making a short at that level not so interesting, as there are many challenges down the road with more risk of being stopped out than cashing in big time.
Author

Filip Lagaart
FXStreet
Filip Lagaart is a former sales/trader with over 15 years of financial markets expertise under its belt.



