Polkadot Price Prediction: DOT stands to lose another 10%
- Polkadot breached a technical supporting force of its rally.
- Red lights flash as price action is making lower lows and lower highs.
- Expect a dip by the end of tomorrow of 10%.

Polkadot (DOT) has broken lower after a month of profits and price action climbing 189%. DOT price was not able to claim the $30 mark, and the price has been fading since.
A few factors are in the mix with the 200-daily Simple Moving Average (SMA), forming a price cap around $28. Add to that the fact that Polkadot could not stay above $30 and get rejected that violently on the first proper test. It proves that buyers have sold off a large chunk of their profits along the way and that $30 was the cherry on top.
Price action now is a typical showcase of sellers taking over
The support line marked up at $27.22 did not deliver much support. Even worse, once it got broken again on August 24, it turned into resistance and rejected an attempt from buyers to get back above. In that move, the green ascending trend line has been broken as well. That trend line originated from July 20 and got broken to the downside on the same day DOT broke below $27.22 on August 24.
Trending lower, DOT did not make new highs, even day-on-day, since August 23. That is a signature pattern where sellers have taken over, and buyers are squeezed out of their long positions.
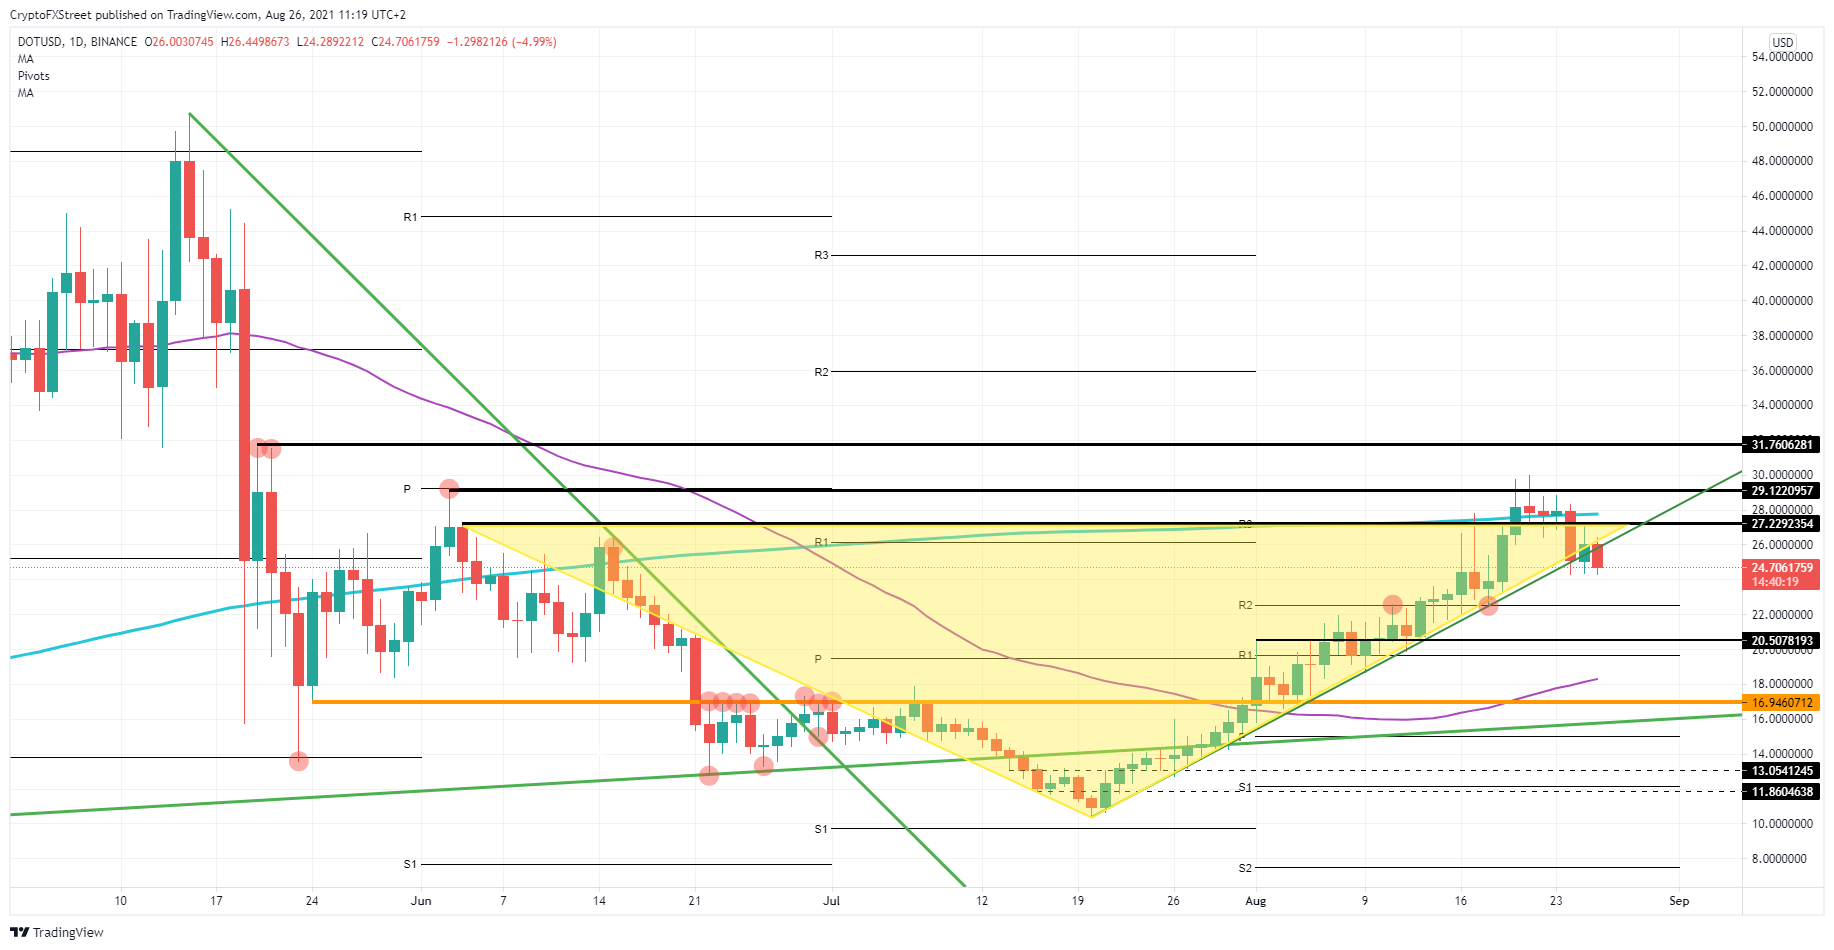
DOT/USD daily chart
The first support that will come into play is at $20.50. That level takes us back to August 1 and August 13. In between, price action hovered below and above this level. In the end though, it was the launching point for the next leg up toward $30.
Just before this level, DOT still has the R2 monthly resistance level at $22.58. This level has already shown that it was used as support on August 18. Although granted its proof, it still looks feeble and probably will not be strong enough to support price action against short-sellers adequately.
Should sentiment in markers roll over and switch back to risk-on, expect a possible return to $27.23 in the near term.
Author

Filip Lagaart
FXStreet
Filip Lagaart is a former sales/trader with over 15 years of financial markets expertise under its belt.


