- Polkadot price dips back below a critical level in a short profit-taking phase.
- As global markets reassess the situation, the slightest tailwind will trigger massive investor inflows.
- Expect price action’s current fade to be contained – with the next target set at $30.
Polkadot (DOT) is clawing its way back after an extended decline, renewing interest from bullish investors. Agile traders were able to pick up DOT coins at the longer-term green ascending trend line, creating a bounce-off move back towards $27, in just two trading days. As the price action takes a slight breather today, investors and traders who missed out on the initial rally have been offered a new window of opportunity. Expect to see further inflows from funds to ramp up price action towards $30.
Polkadot price action set for $30, a crucial longer term objective
Polkadot price action is at a turning point in the trend where cool-headed investors are expected to sit on their hands and refrain from taking large chunks of profit, as they wait for prices to cruise higher. The entry on Monday at the green ascending trend line was a perfect technical play that many experienced market participants will have used to join DOT price action. The initial rally pushed higher towards $27.23 but is seeing a pullback now as short-term participants book profits and global markets remain muted.
Expect the pullback in DOT price action to be contained as major fundamental changes are unlikely. nvestors that missed the first entry point can also now join the trend as it pops higher, with the Polkadot price reaching $30 potentially by Friday. That level will be crucial for an extension of the uptrend as it is where the monthly pivot and both the 200-day and the 55-day Simple Moving Averages (SMAs) are located. If bulls can refrain from taking large profits too soon , a death cross (crossing 55-day below 200-day SMA) can be avoided, and a return to $50 could be in the cards longer term.
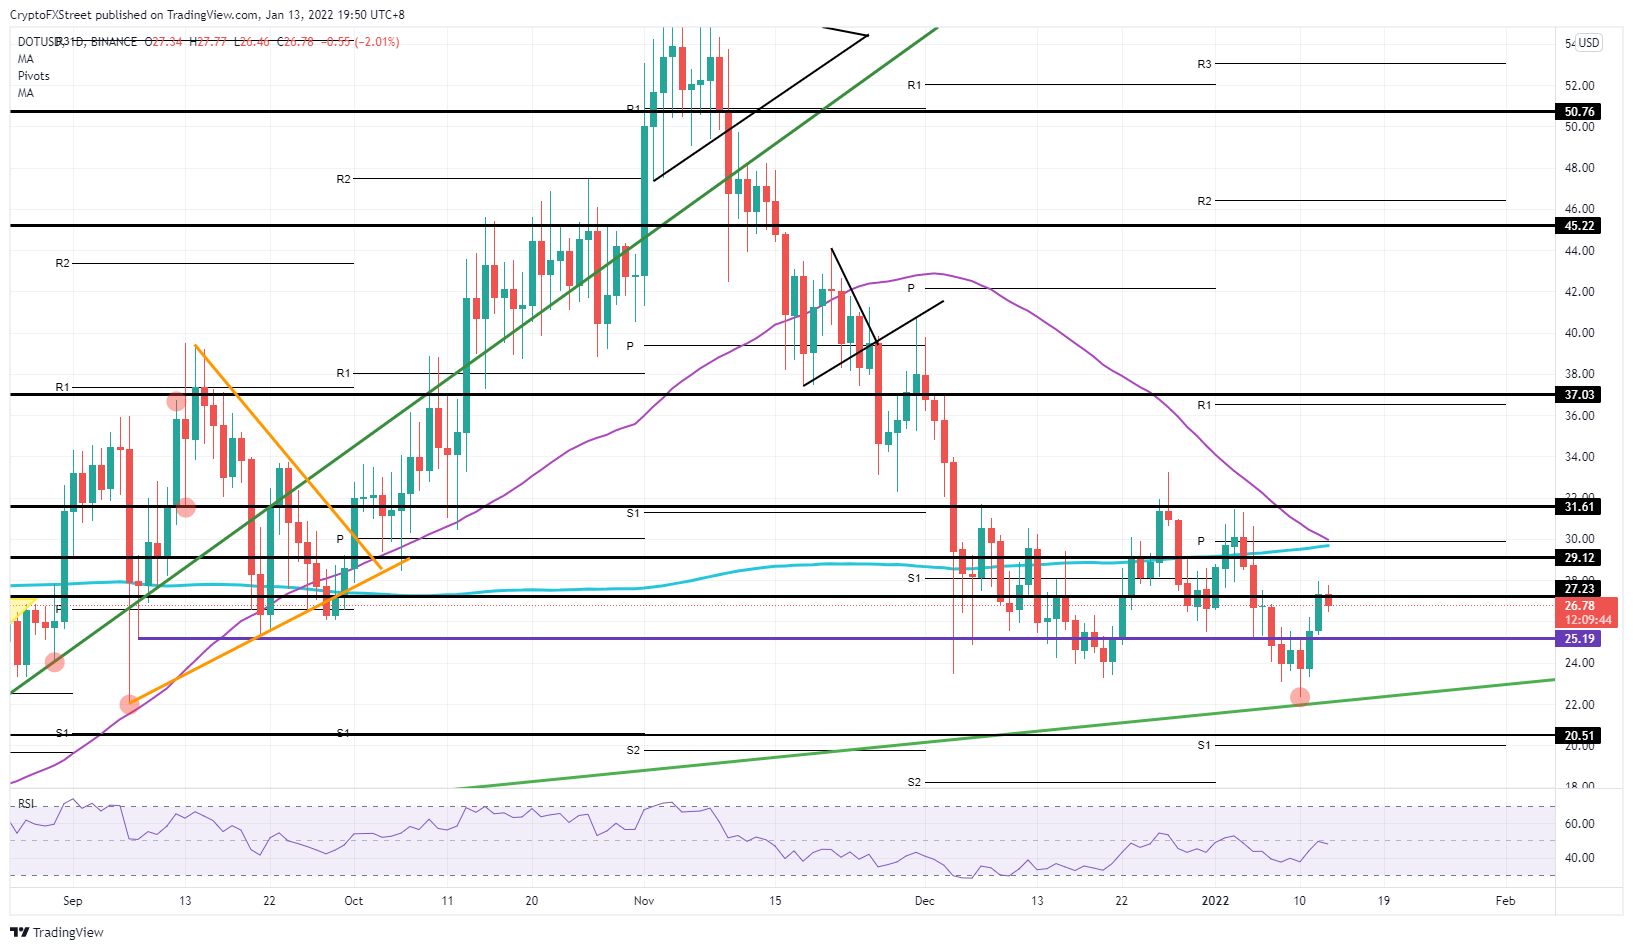
DOT/USD daily chart
The risk to the downside comes from geopolitical conflicts fading into the background. There is a chance, however, that these could quickly flare up again and spark a broad based sell-off in the markets, which would cause significant headwinds for Polkadot. Bulls could be pushed against the green ascending trend line as pressure mounts – with a break towards $20.50 and the monthly S1 trying to take the pressure and provide a floor. At such a level investors would likely see Polkadot price as offering a seductive discount opportunity, rather than part of a broader sell-off.
Information on these pages contains forward-looking statements that involve risks and uncertainties. Markets and instruments profiled on this page are for informational purposes only and should not in any way come across as a recommendation to buy or sell in these assets. You should do your own thorough research before making any investment decisions. FXStreet does not in any way guarantee that this information is free from mistakes, errors, or material misstatements. It also does not guarantee that this information is of a timely nature. Investing in Open Markets involves a great deal of risk, including the loss of all or a portion of your investment, as well as emotional distress. All risks, losses and costs associated with investing, including total loss of principal, are your responsibility. The views and opinions expressed in this article are those of the authors and do not necessarily reflect the official policy or position of FXStreet nor its advertisers. The author will not be held responsible for information that is found at the end of links posted on this page.
If not otherwise explicitly mentioned in the body of the article, at the time of writing, the author has no position in any stock mentioned in this article and no business relationship with any company mentioned. The author has not received compensation for writing this article, other than from FXStreet.
FXStreet and the author do not provide personalized recommendations. The author makes no representations as to the accuracy, completeness, or suitability of this information. FXStreet and the author will not be liable for any errors, omissions or any losses, injuries or damages arising from this information and its display or use. Errors and omissions excepted.
The author and FXStreet are not registered investment advisors and nothing in this article is intended to be investment advice.
Recommended Content
Editors’ Picks
Ripple's move above this key level could trigger nearly 50% rally for XRP
Ripple has overcome a critical resistance level and flipped into a support floor on the weekly time frame. This development happened while XRP tightly consolidated for roughly 250 days. Investors can expect XRP to kickstart a massive rally.
Optimism price outlook with nearly $90 million worth of OP tokens flooding markets on Friday
Optimism volatility has shrunk in the ours leading to the network’s cliff unlock. It joins the likes of dYdX and Sui, which have similar events on their calendars. As token unlocks are often considered bearish catalysts, investors should brace for a reaction after the event.
Top 3 Price Prediction Bitcoin, Ethereum, Ripple: Retail watches from the sidelines with a bias for shorts
Bitcoin could clear $73,777 peak as BTC bulls resurface. Ethereum might fall 10% before next leg up as ETH RSI teases with sell signal. XRP could lose $0.6000 threshold as Ripple bulls fail to show up.
Jito price could hit $6 as JTO coils up inside this bullish pattern
Jito price action shows a potential cup and handle formation. Based on theoretical measurement rules, a successful breakout could yield a 56% rally to $6.0. A breakdown of the $3.86 support level would create a lower low for JTO and invalidate the bullish thesis.
Bitcoin: BTC may have recovered, but is it out of the woods?
Bitcoin’s (BTC) upward momentum has shown a significant decline for the past two weeks or so. This development led to a bearish signal on the weekly and an uncertain outlook on the monthly.