Polkadot Price Prediction: DOT achieves statistical first, but beware of a shake-out
- Polkadot price attracts resistance at the 200-day simple moving average (SMA) while holding the dominant July ascending trend line.
- DOT retracement levels define a pivotal range that will determine the price direction for the weeks ahead.
- Polkadot price logs the fifth consecutive positive week for the first time with a gain of 19.51%.

Polkadot price has been a relative strength leader since the July low, recording a 185% gain at the August 21 high. Until August 20, the rally had been interrupted by only seven negative days, with only one day exceeding -4%. However, the intersection of the 200-day SMA with a series of highs in late May and early June has established the first serious point of resistance for DOT since the July 7 high of $17.88.
Polkadot price confronts an array of technical warnings
The first warning sign for a Polkadot price pullback is the existence of a bearish momentum divergence on the 6-hour chart at the rally high. The other bearish momentum divergences during the move on August 7 and August 11 evolved into 14% and 12% declines, but in neither case was DOT at an inflection point as is the case now.
A drop of 14% would position Polkadot price below the July ascending trend line and near the 38.2% retracement at $25.78.
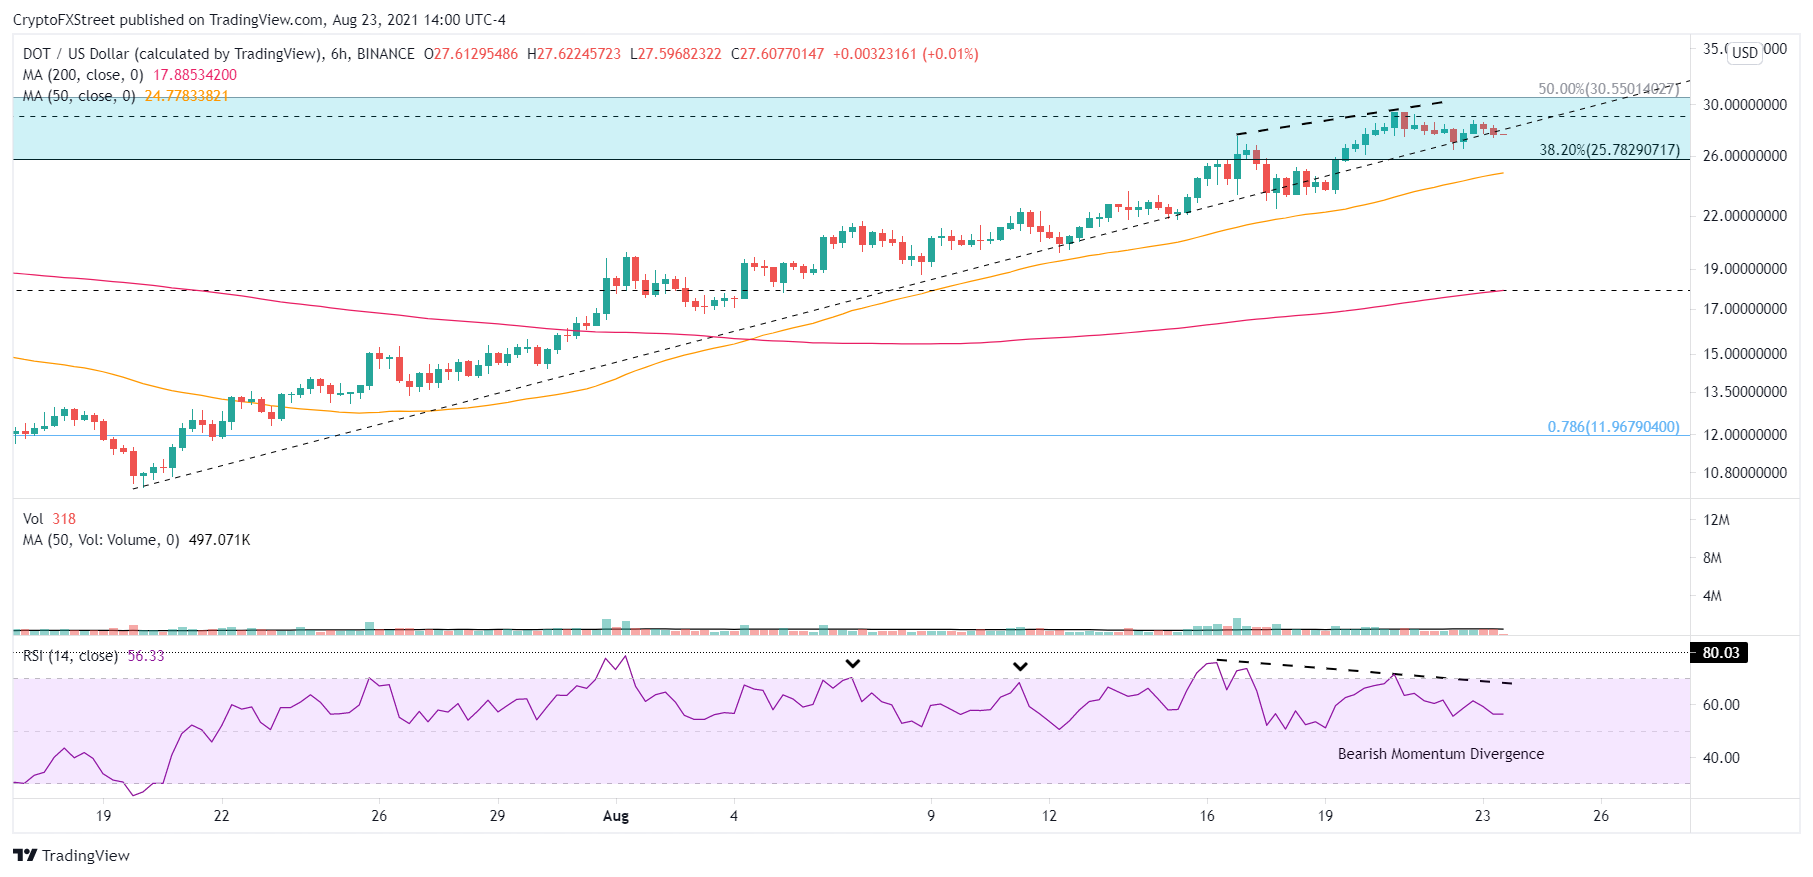
DOT/USD 4-hour chart
On the daily chart, Polkadot price does not show a bearish momentum divergence. Instead, the daily Relative Strength Index (RSI) reached its highest reading since the February high, indicating an extreme overbought condition and increasing the potential for a DOT reversal. The extreme reading coincided with Polkadot price trying to capture the 200-day SMA and stretch to the 50% retracement of the May-July correction at $30.55.
The complexity of the price structure is intensified by Polkadot price congestion between the 38.2% and 50% retracement levels extending back to February that includes the late February low and the March and April lows. The importance of the price congestion was revealed when it rejected the DOT rebound following the May 19 collapse and two sprints higher in June.
Polkadot price needs to log a daily close below the 38.2% retracement at $25.78 and the July ascending trend line to confirm the cautious short-term forecast.
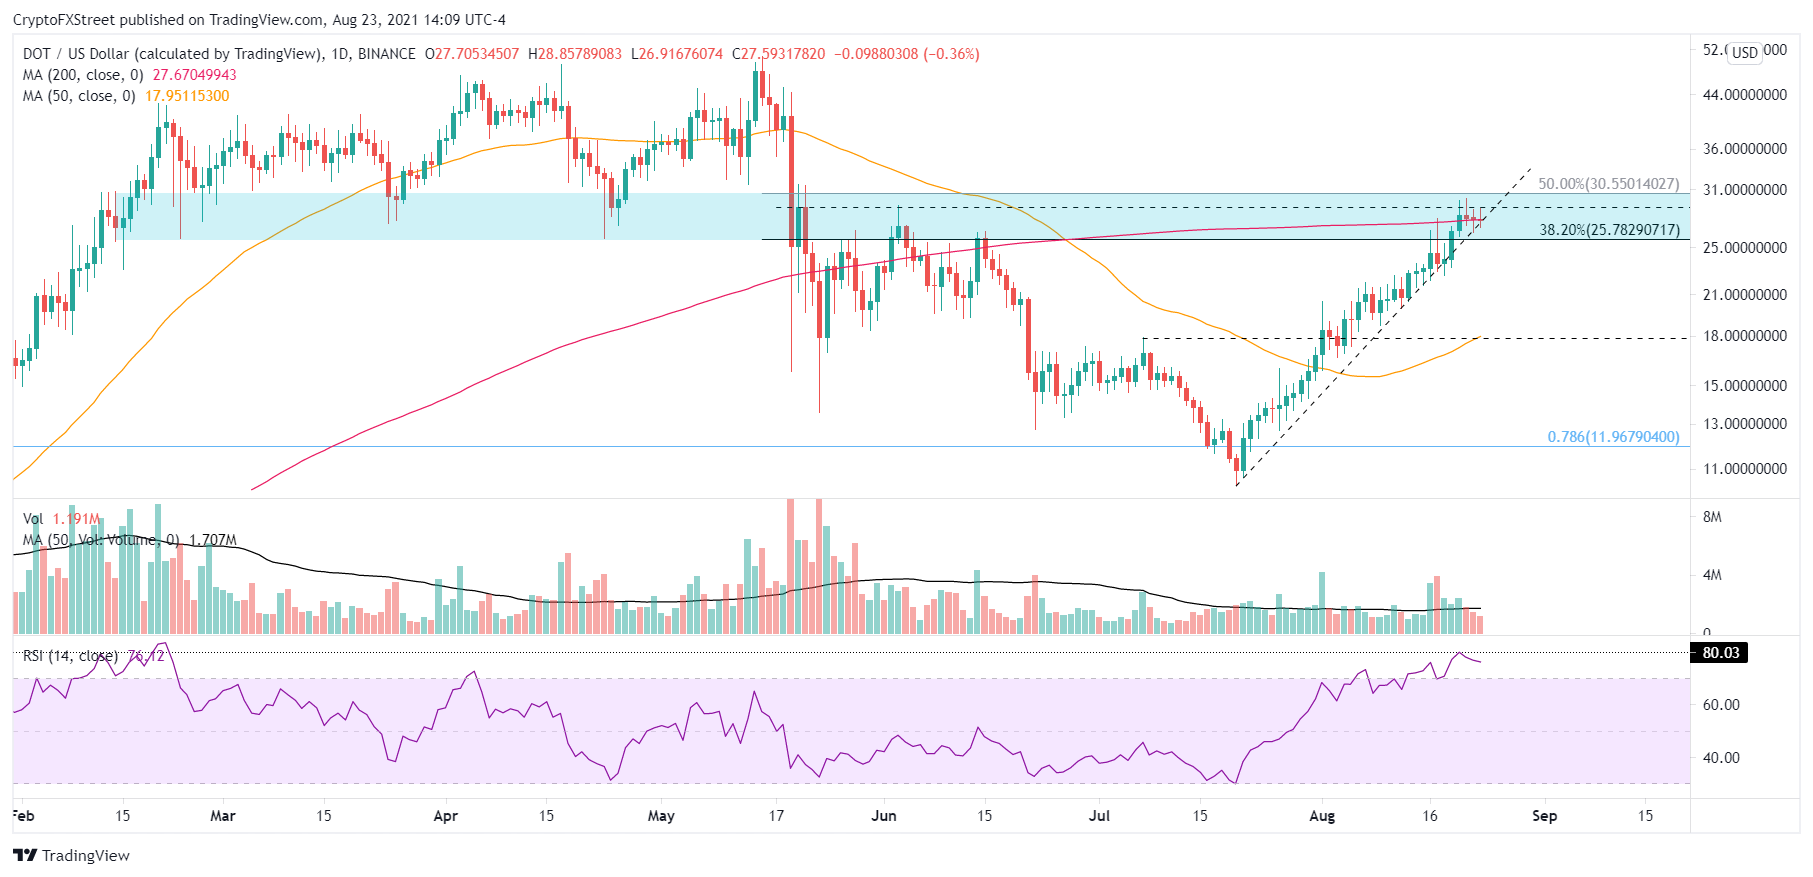
DOT/USD daily chart
To void the cautious outlook, Polkadot price needs a close above the 50% retracement at $30.55, thereby turning the resistance into support and clearing a path to the DOT all-time high of $50.74.
As explained above, the catalysts exist for a deeper Polkdot price retracement, including an extreme overbought condition on the daily RSI, a bearish momentum divergence on the DOT six-hour chart, the presence of two important retracement levels and a range of price congestion extending back to February. Once the weak holders are removed, Polkadot price can pursue higher prices.
Author

Sheldon McIntyre, CMT
Independent Analyst
Sheldon has 24 years of investment experience holding various positions in companies based in the United States and Chile. His core competencies include BRIC and G-10 equity markets, swing and position trading and technical analysis.


