|

Polkadot price likely to fall into $16

  • Polkadot price failed to retest the breached trend line.
  • DOT price candlesticks are in a steep decline.
  • Invalidation for the bearish scenario will be a close above $19.45.

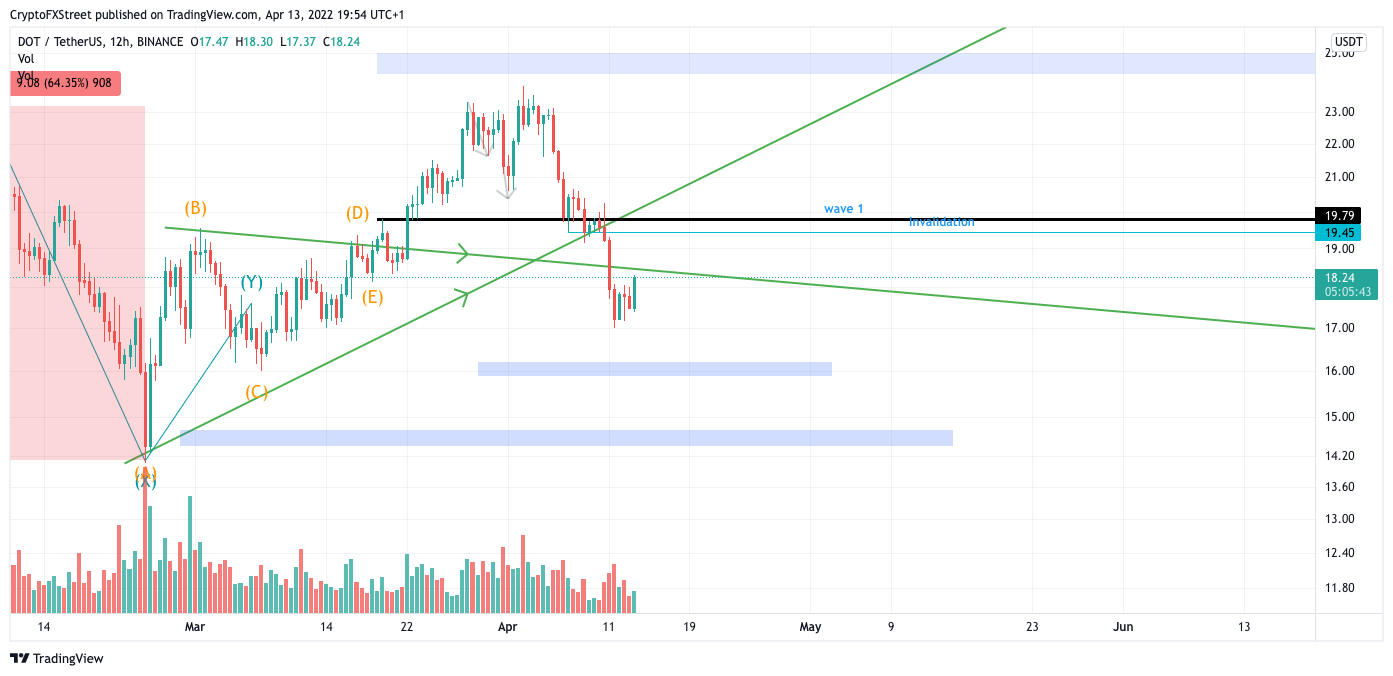
Polkadot price displays bearish strength as the price has fallen below a key trend line. The $18 DOT price retests the broken line and could see strong resistance. 

Polkadot price looks lethal.

Polkadot price is looking unfavorable amongst professional traders as the digital asset has printed the largest bearish engulfing candle this month which closed below the key WXY trend line from March. The bulls' failure to support the key trend line spells for a disastrous situation for DOT investors. DOT price next targets are likely $16 and $14, but the digital asset could see some counter-trend chop before the fall occurs.

Polkadot price volume is increasing in bearish favor, which should concern investors. The digital assets' steep decline is signaling strong control of the trend from the bears. Traders should look for entries on smaller time frames to join the bears with an understanding that the drop may take more time to occur.
TM/Dot/4.13.22

DOT/USDT 12-Hour Chart

The safest invalidation to use will be the swing low at $19.45. The bearish scenario will void if the bulls establish a closing candle above the invalidation level. Subsequently, the bulls could take the price back towards $20 and $22, resulting in a 20% increase from the current Polkadot price. 

Author

FXStreet Team

Composed of a group of economic journalists and FX experts, the FXStreet content team produces and oversees all content published on FXStreet. It provides a purely journalistic approach to the Forex market.


More from FXStreet Team
Share:

Editor's Picks

Bitcoin Price Forecast: BTC extends pullback as profit-taking weighs
Bitcoin (BTC) trades below $84,000 at the time of writing on Thursday, extending the pullback for the third consecutive day as profit-taking weighs in. Despite the price correction, strong institutional demand alongside sustained accumulation by the 100–1,000 BTC holder cohort could support the Crypto King.
XRP is flashing three bullish signals heading into a historically weak October
XRP (XRP) is still flashing 3 bullish signals across its holders, derivatives, and ETF data. These signals come as the token gave back part of its September gains on Thursday. The token traded near $1.50 at press time, down about 6.3% over 24 hours, according to BeInCrypto Markets data. The pullback still leaves XRP up over 15.6% on the week, a gain that tracks a broader market rally.
Crypto Today: Bitcoin, Ethereum, and Ripple – Bulls start to lose control
Bitcoin (BTC), Ethereum (ETH), and Ripple (XRP) are trading in the red on Thursday after losses of 2% to 4% the previous day. The major cryptos are starting to lose bullish control in the near term so far this week, despite the institutional funds witnessing steady inflows. The technical outlook for Bitcoin, Ethereum, and Ripple indicates near-term downside risk.
Litecoin token has its moment as network activity booms
Litecoin, the cryptocurrency considered silver to Bitcoin's gold, and one that's often missing from day-to-day crypto discussions, has bucked the broader market weakness over the past 24 hours. LTC currently ranked 24th largest by market cap, has gained nearly 8% to $66 in 24 hours, the highest since January.
Bitcoin: BTC shrugs off CLARITY Act setback and hawkish Fed
Bitcoin (BTC) price action has remained resilient this week, trading above $78,000 at the time of writing on Friday, heading toward a key resistance zone. Institutional demand shows early signs of weakness, with spot Exchange Traded Funds (ETFs) on track for a second straight week of outflows, with over $420 million recorded through Thursday amid escalating Middle East tensions.