Polkadot price could dip 10% to collect liquidity for a bullish breakout
- Polkadot price has broken past a significant barrier.
- Still, DOT is missing the liquidity to advance further.
- A decisive close above $19.35 could lead to a bullish breakout.

Polkadot price is something investors should watch closely as it retests a crucial support level. Still, some questionable evidence with the current price action suggests prices could dip lower before an upswing.
Polkadot price says bulls may have jumped the gun
Polkadot price has been coiling into a WXY pattern on the four-day chart, with the Y wave forming a symmetrical triangle. Now on the 8-hour chart, bulls may have jumped the gun. The E wave within the triangle is unclear in terms of structure and dimensionality.
Secondly, Polkadot price has begun the correction ideally within the consolidation level for the Relative Strength Index. There is, however, a slight uptick in volume, so traders need to be on the lookout for bullish entries nonetheless.
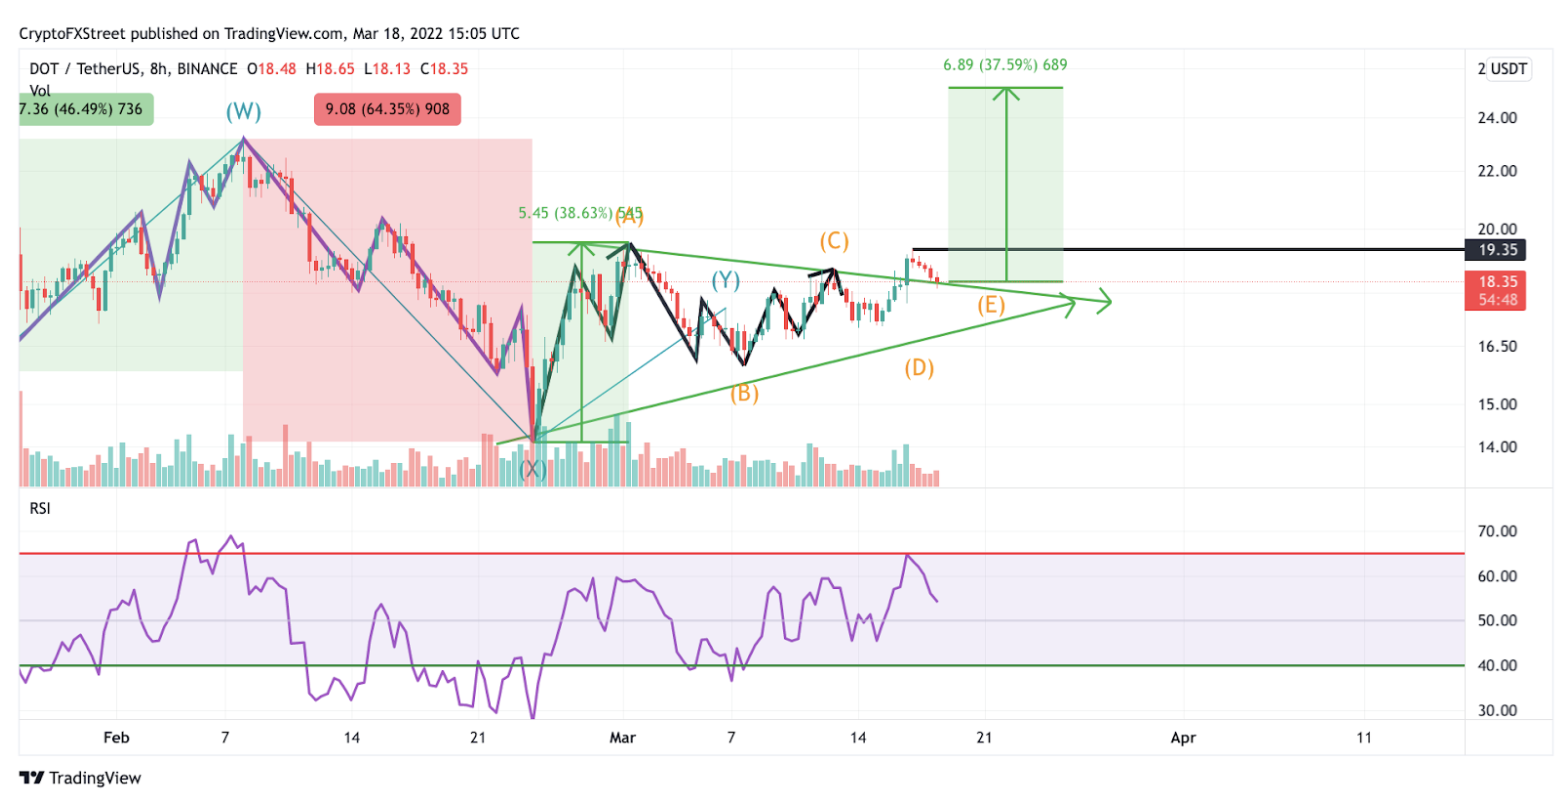
DOT/USDT 8-Hour chart
It is possible that what Polkadot price is witnessing the finalized piece of Wave D, and now it will go for wave D in the future. It is very common for triangles to make multiple swings into a coiling trend line before establishing the final pivot point.
If this is the case, DOT price will likely rotate lower into $18 and even 16 to establish symmetrical-looking price action in this support zone.
A break above $19.35 should send the Polkadot price flying as triangles must always result in 5 wave impulse rallies. DOT price will likely rally into $22 and $25, currently 38% above the current price.
Author
FXStreet Team
FXStreet
Composed of a group of economic journalists and FX experts, the FXStreet content team produces and oversees all content published on FXStreet. It provides a purely journalistic approach to the Forex market.


